Application of commercial sand aggregates in hydrophobized hydraulic concrete materials
Utilización de arenas comerciales en materiales de concreto hidrofobizados
Ernesto Mora1, Erick Castellón2
Fecha de recepción: 2 de noviembre, 2023
Fecha de aprobación: 6 de marzo, 2024
Mora, E; Castellón, E. Application of commercial sand aggregates in hydrophobized hydraulic concrete materials. Tecnología en Marcha. Vol. 37, No 4. Octubre-Diciembre, 2024. Pág. 171-183. https://doi.org/10.18845/tm.v37i4.6934
Keywords
Concrete matrix; hydrophobic particles; porous-media; characterization; water transport.
Abstract
Because precursors such as sand are generally accessible, concrete has become a widely used construction material. Not all available sands, however, fulfill the requirements of purity, granulometry, shape and porosity for use in concrete materials. Here we report the setting of the hydrophobicity of hydraulic concrete matrices prepared with commercial sands and hydrophobic silica particles (dodecyl-modified silica) added to their mixtures. The granulometry and porosity of the selected fine aggregates were confirmed to influence the water absorption of hydrophobized concrete matrices. Water absorption decreased more than 30 % on addition of silica hydrophobized with dodecyl. As the functionalization was performed from the mix prepared with commercial sands, an improved hydrophobicity of the materials was provided integrally to the matrix.
Palabras clave
Caracterización de arenas; concreto; partículas hidrofóbicas; matriz; porosidad; transporte de agua.
Resumen
El concreto hidráulico es uno de los materiales de construcción más empleados debido a la ubicuidad de sus precursores: agua, cemento, agregados finos y gruesos. Uno de los agregados principales es la arena, sin embargo, no todas las arenas disponibles cumplen los requisitos de idoneidad, pureza, graduación, forma y porosidad. Algunas soluciones para el mejoramiento de arenas para su uso en la fabricación de concreto hidráulico son la combinación de agregados finos, uso de aditivos, alternativas de reemplazo e incremento en la cantidad de cemento, entre otras posibilidades remediales. Este artículo describe la formulación de materiales de concreto hidrofóbicos con tres tipos de arenas (con porosidades, granulometrías y finuras diferenciadas entre sí). La hidrofobización del concreto se realiza al incorporar partículas de sílices modificadas químicamente y se estudia la interacción de estas partículas con las diferentes arenas. Se confirmó que la graduación y la porosidad de los agregados finos seleccionados influye en la absorción de agua de las matrices de concreto, sin embargo, se logra una mejora de más del 30% en la hidrofobicidad de la matriz al agregar sílice hidrofóbica.
Introduction
Hydraulic concrete and its precursor components are widely available sources of raw materials for construction purposes [1-6]. Despite the apparent simplicity of the technology of the conventional production of hydraulic concrete, the microstructure of the product is complicated, containing a heterogeneous distribution of several solid composites, including voids of various shapes and sizes that might be completely or partially filled with solutions related to the hydration [5,7,8]. Unlike other materials such as steel, plastic and ceramics, concrete is not totally inert or static; the durability conditions of the material are governed by the complicated microstructure of its matrix.
In concrete matrices, the paste and fine aggregates importantly determine the general characteristics of water transport through the materials. Adjusting the hydrophobicity of concrete matrices can benefit the durability of the materials on decreasing the passage of water through them; this situation minimizes damage from volumetric changes, abrasion, and intrusion of external agents. Two aspects must, however, be controlled: the fraction of water to cement, and the selection of fine aggregates. To select these aggregates, one should consider their source, shape of grain, porosity, purity and granulometry. [4-6,9,10]
In addition, the sand or fine aggregate interacts directly in the matrix. In general, common sand for use in concrete mixtures is a derivative of a rock cycle process. Sand can be specifically defined in terms of its particle size; this material passes through a sieve 4.75 mm × 4.75 mm (No. 4 sieve) and is predominantly retained on a sieve 0.075 mm × 0.075 mm (No. 200 sieve) [6,11,12]. For experimental purposes there are sand options such as those described in the ASTM standards C778 and 20-30. For commercial purposes, sand types can be classified according to source (quarry sand or river sand), and to its industrial processing (for example, level of grinding, washing, and sieving).
For example, a fresh concrete containing fine aggregates of poor quality in terms of distribution of granulometry, is susceptible to segregation during consolidation. Also, if the sand grains have a laminar shape, the concrete strength might be affected; if the aggregate has impurities, such as organic matter (clayey sand), excess salts (sea sand) or acids (volcanic sand) it might affect the concrete stability, adherence, and durability. The characteristics of the transition zone also influence concrete durability; hence the influence of the fine aggregate on the hydrophobicity of a hydraulic concrete matrix requires analysis. [5-7,13]
Sand is a material widely available in the American tropics, but in other regions the sands of river basins might have poor granulometry distribution, or the predominant sand is unsuitable for use in concrete mixtures. It is hence relevant to conduct studies of the use of sea sand, dune sand or other deposits. Combinations or partial replacements are proposed as alternatives [14-17]. In Costa Rica, Central America, the sands typically commercially available and frequently used are quarry sands (from the Santa Ana - Alajuela area) and river sands (from the Atlantic, North, or Pacific areas). After a simple industrial treatment, these sands generally fulfill the desirable conditions to produce hydraulic concrete mixtures, in accordance with the best construction practices.
Here we report the adjustment of the hydrophobicity of hydraulic concrete matrices prepared with commercial sands with hydrophobic silica particles (dodecyl-modified silica) added to their formulations. As the functionalization was performed during the formulation of the concrete materials prepared with commercial sands, the improved hydrophobicity of the materials was conferred to its integrity, not merely to the molding surfaces.
Materials and methods
Synthesis of hydrophobic silica particles
The hydrophobic silica particles were synthesized according to a reference process [18]. These silica particles (pyrogenic silica, Wacker HDR N20, average diameter 220 nm) were degassed and dried in an oven at 120 °C for 2 h under decreased pressure. After being dried, the silica particles (30 g) were dispersed in heptane (1 L, Aldrich) in a spherical flask (2 L); the mixture was stirred for 30 min. Diethylamine was added as a catalyst (2.3 mL, Aldrich); the mixture was magnetically stirred and refluxed at 87 °C.
After adding n-dodecyltriethoxysilane (4.40 mL, Aldrich), the mixture was refluxed for 2 h. A Dean-Stark trap was subsequently used to eliminate at least 40 % of the solvent; the remaining solvent was extracted with a rotary evaporator. The n-dodecyl-functionalized silica particles were dried at 100 ° C for 8 h in an oven and stored.
Fine aggregates: characterization
Three fine aggregates were selected for the experiments (Ottawa-A, river-B and quarry-C). Marked differences in their absorptions were detected. In addition, granulometries, fineness module (F), specific gravity and absorption were assessed. [19,20]
The samples and curves of size distribution of the three sands (A, B, C) are displayed in Figures 1 and 2 respectively.
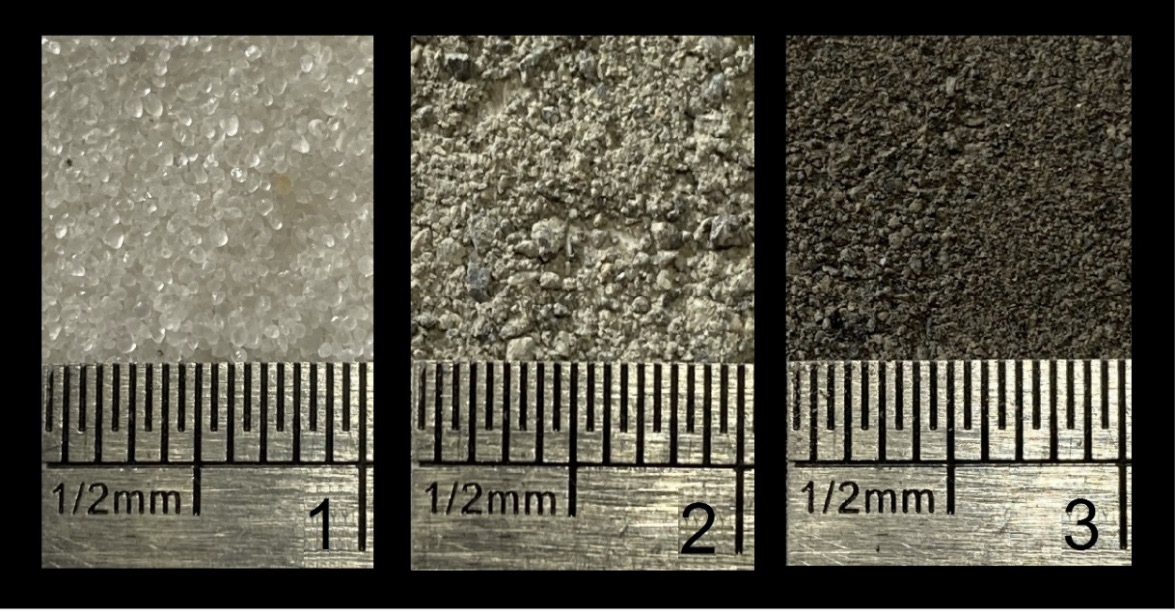
Figure 1. Fine aggregates selected for the experiments, (1) Ottawa sand—A, (2) river sand—B and (3) quarry sand—C. The photographs have width 10 mm.
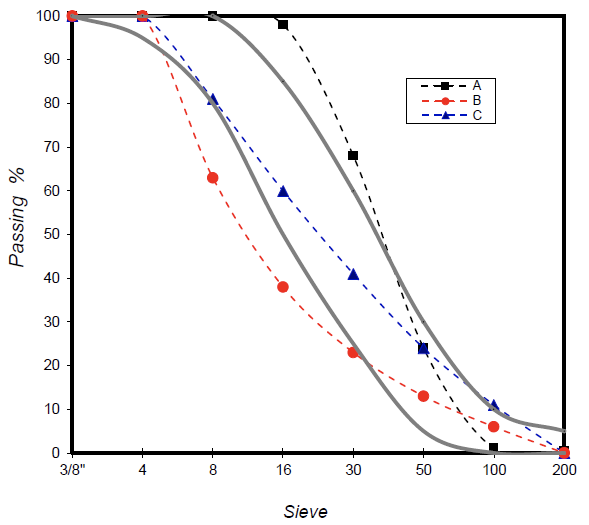
Figure 2. Size distribution for fine selected aggregates. (A) Ottawa sand, (B) river sand and (C) quarry sand. Continuous curves mark the ideal limits for the distribution of grains.
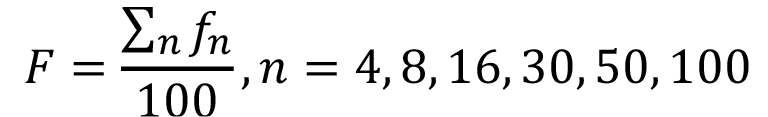
A fineness module (F) for each sample was obtained from the retained percentages accumulated in the sieves number 4, 8, 16, 30, 50 and 100. The fineness module of a sand is defined as the sum of percentages of the material retained in the sieves number 4, 8, 16, 30, 50 and 100 divided by 100 [19]:
 (1)
(1)
in which fn is the percentage of material retained in sieve number n. The fineness modules of the selected fine aggregates are shown in Table 1.
Table 1. Modules of fineness of the sands (A, B, C).
|
Sand |
F |
|
A |
2.10 |
|
B |
3.57 |
|
C |
2.83 |
Relative densities and absorptions of the selected fine aggregates were measured according to norm ASTM C128-15 [20]; the results are displayed in Table 2.
Table 2. Relative densities and absorption percentages of the sands (A, B, C).
|
Sand |
Relative densities |
Absorption of sand / % |
|
A |
2.650 |
0.02 |
|
B |
2.535 |
3.46 |
|
C |
2.006 |
7.76 |
Porosity and nitrogen adsorption
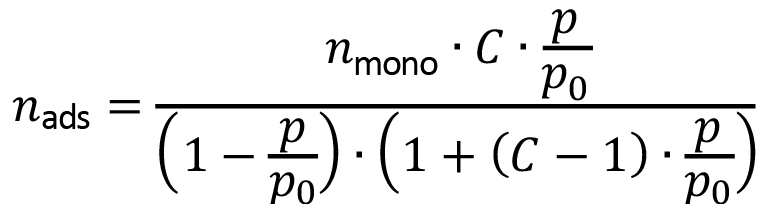
Measurements of nitrogen adsorption were performed on a vacuum line. Helium served to calibrate the volume of the equipment. The specific BET surface was obtained on adjusting the experimental data according to the model of Brunauer, Emmet and Teller (BET) [21],
 (2)
(2)
in which nads is the specific amount of nitrogen adsorbed in the adsorbent (in moles per unit of adsorbent mass) at the relative pressure p/p0 (p0is atmospheric pressure or saturation pressure); C is a parameter related to the adsorption and vaporization enthalpies of nitrogen, and nmono is the specific amount of nitrogen that conforms to a monolayer in the adsorbent (assessed material). The latter parameter allows to calculate the specific BET surface of the materials as SBET = nmonoNAAN2; NA is Avogadro constant; and AN2 is the cross-sectional area of a dinitrogen molecule (AN2 = 0.162 nm2). The data analyzed with regression were selected to be in the range of relative pressures between 0.02 and 0.25.
The total porosity of the fine aggregates was estimated from the total amount of nitrogen adsorbed at relative pressure 0.95. At this pressure, we considered that almost all pores (from micropores to macropores) were filled with nitrogen. Adsorbed nitrogen is found in a liquid state (due to capillary condensation); the volume of total porosity is calculated as nads(p/p0 = 0.95) MN2/ , in which MN2 = 28.0 g mol-1 , and = 0.808 g cm-3.
Formulation and molding of concrete samples
Six specimens were formulated and cast. Samples in blank groups with no added hydrophobic silica particle, labeled A0, B0 and C0, were prepared with fine aggregates Ottawa sand-A, river sand-B and quarry sand-C, respectively. Samples in a second group, labeled A1, B1 and C1, were prepared with sands A, B and C, respectively and with added hydrophobic silica particles.
Each sample was formulated with Portland cement Type I, distilled water and fine aggregates A, B or C. Samples A0, B0 and C0 contained no hydrophobic silica particle, whereas samples A1, B1 and C1 were formulated with them. Table 3 summarizes these preparations.
Table 3. Preparation of samples; each proportion is relative to the mass of Portland cement.
|
(Mass of component) / (Mass of cement) |
||||||
|
Sample label |
A0 |
B0 |
C0 |
A1 |
B1 |
C1 |
|
Hydrophobic silica particles |
0.00 |
0.00 |
0.00 |
0.04 |
0.04 |
0.04 |
|
Portland cement |
1.00 |
1.00 |
1.00 |
1.00 |
1.00 |
1.00 |
|
Fine aggregate |
2.73 |
2.73 |
2.73 |
2.69 |
2.69 |
2.69 |
|
Water |
0.49 |
0.49 |
0.49 |
0.49 |
0.49 |
0.49 |
Each preparation was stirred with a paddle mixer and cast into cubic molds (Teflon®) of side 25 mm (adaptation of the norms ASTM C109/C109M-16a). [22]
The anti-adherent molds allowed the formation of cubic samples of concrete matrices free of demolding substances that might affect the materials for surface, water absorption and drying evaluations [23]. Once molded, the samples were allowed to harden in the molds. After 24 h, the samples were removed from the containers and cured on immersion in water for 28 days. The specimens were then dried under environmental conditions (25 ° C, relative humidity 60 %) for seven days.
Contact angles
The contact angle with water was measured on placing a sessile water drop (10 μL) on a clean and regular surface of each sample. Digital photographs of the drops were processed and analyzed (DropAnalysis, software ImageJ). [24]
Water absorption
The rate of water absorption by a cured and dry sample was measured on submerging each cube in an exact volume of water in an hermetic container. At defined time lapses, the water in contact with the specimens was poured into a graduated cylinder to measure the non-absorbed volume of water. The relative absorption parameter A is defined as:
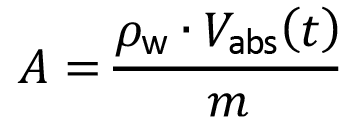 (3)
(3)
in which  is density of water (= 1.00 g/mL) at temperature 25 °C, Vabs is volume of water absorbed at time t and m is mass of the dry sample used in the experiment.
Drying kinetics
The concrete material samples (cubes of side 25 mm) were immersed in water for 28 days for curing. Upon completion of this period, the cubes were completely saturated with water. The drying of the samples was gravimetrically measured at 25 °C in an environment with relative humidity 60 % for 72 h.
Results
Porosity of fine aggregate
Figure 3 shows isotherms of nitrogen adsorption (at -196 °C) of the studied sands. The order in the porosity and the specific BET surface of the fine aggregates is A < B << C. This trend of porosity conforms to that of the water absorption of the sands and the source of each fine aggregate. The capacity of a fine aggregates to absorb water is related to the accessible internal volume of the materials (their porosity). The porosity and the specific BET area of A (Ottawa) was practically imperceptible, in accordance with its great crystallinity.
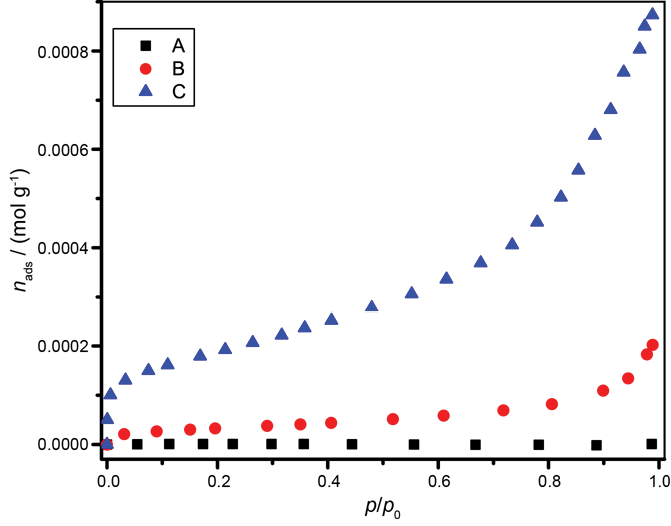
Figure 3. Nitrogen isotherms at temperature -196 ° C of fine aggregates A (Ottawa), B (river) and C (quarry).
The specific BET surfaces and the resulting porosities are presented in Table 4.
Table 4. Specific BET surfaces and porosities of A (Ottawa), B (river) and C (quarry).
|
Sample |
Total specific porosity / cm3 g-1 |
BET / m2 g-1 |
|
A |
0.000 |
0.10 |
|
B |
0.005 |
2.72 |
|
C |
0.027 |
15.0 |
A linearized version of the BET isotherm was used such that data point 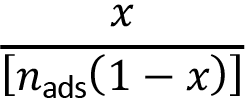 was adjusted to a linear model based on relative pressure x = p/p0. For fits with this linearized version, the intervals of relative pressures were selected according to a criterion that the data of nads(p0 - p), depending on p/p0, must have an increasing tendency. [25]
Surface properties of concrete matrices
Hydraulic concrete is an intrinsically hydrophilic composite material according to its chemical composition and morphological traits. Its components, which are highly polar inorganic substances, arise upon hydration of several calcium silicates [8,12,13]. The resulting hydrated substances crystallize and embed other hydrophilic materials such as sand. Water-contact angles of the samples formulated without hydrophobic particles (A0, B0, C0) showed the hydrophilic character of all samples (small angles, of order 35°, Table 5). This hydrophilic character of the samples decreased with the functionalization of the concrete matrices with hydrophobic silica particles (samples A1, B1, C1), with the advantage that this functionalization of the matrices was performed with a small proportion of hydrophobic particles (mass proportion particles/cement = 0.04). All matrices formulated with hydrophobic particles showed similar contact angles, about 95 °, regardless of the type of fine aggregate (porosity and granulometry).
Table 5. Contact angles of sessile water droplets placed on material surfaces of concrete matrices formulated; Each uncertainty is a standard deviation of six values of contact angles (left and right angles of three independent drops)
|
Sample |
Contact angle / deg |
|
A0 |
39 ± 5 |
|
B0 |
36 ± 4 |
|
CO |
29 ± 6 |
|
A1 |
101±4 |
|
B1 |
95 ± 5 |
|
C1 |
92 ± 5 |
Dynamics of water absorption
For each cube sample (25 mm), the quantity of water absorbed for varied duration t was measured. The mass of water measured was normalized with the initial mass of the dry sample (Equation 3). The cubic samples were saturated on immersion in water for 72 h. In addition, there were dynamic aspects that were considered after numerical simulation of the experimental absorption data with respect to time, for example, the specific rate of first- order water diffusion k and the maximum achievable specific absorption at infinite time A∞.
Dynamic specific absorption as a function of time was based on the Kibler-Carter model [18,26],
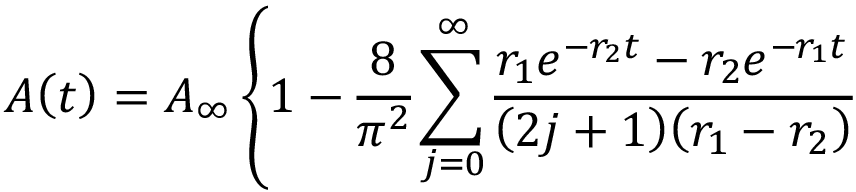
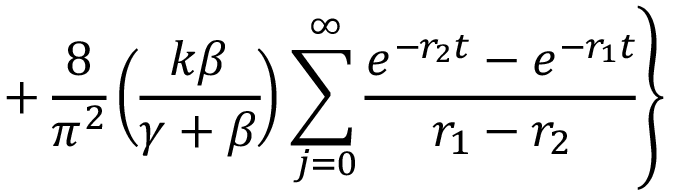 (4)
(4)
in which


According to this model, the water diffuses inside a material at specific rate k. During this diffusion through the material, the interior water molecules might be free or bound. Parameter γ represents the specific rate of water interconversion from free to bound; β represents the specific rate of water from bound to free.
For concrete matrices, the hydrophilic character of the calcium silicate matrix governs the water absorption. This hydrophilic condition is, however, intrinsic to the matrices and can become modified when formulating specimens with hydrophobic particles [18]. The selection of aggregates to formulate a concrete material affects its final water-transport properties. For example, fine aggregate C had the larger porosity among the assessed fine aggregates and showed great water absorption, but an ideal grain size distribution. In contrast, aggregate B presented intermediate porosity and absorption with a deficient granulometric curve.
Absorption of conventional hydraulic concrete materials is known to depend on the fraction water / cement. An effective granulometry of a sand containing grains of varied size is desirable to fill the spaces completely.
Figure 4 shows the experimental data of specific water absorption of the six samples of concrete matrices evaluated as a function of time.
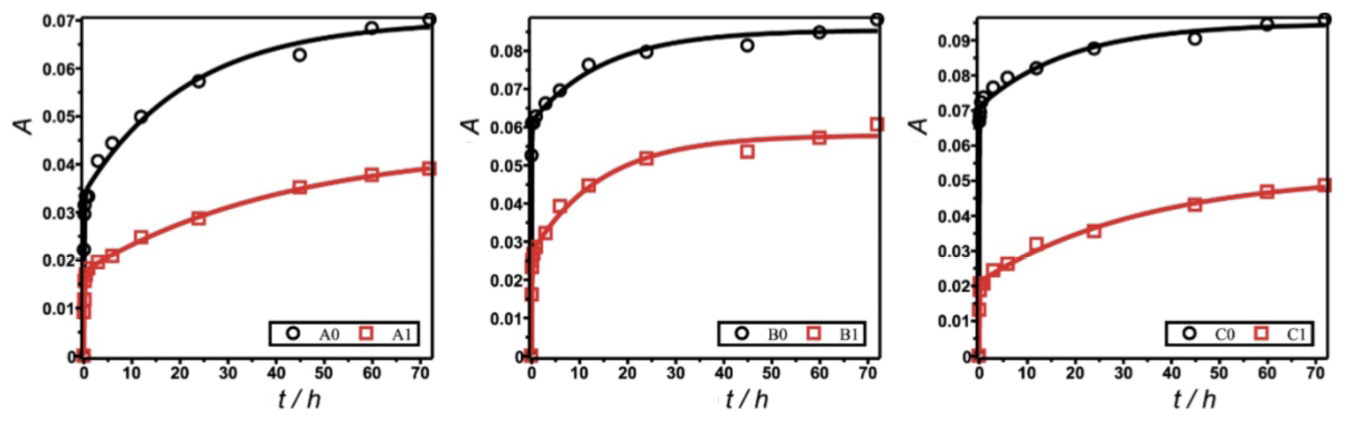
Figure 4. Dynamics of water absorption of the concrete materials samples prepared with sands A, B, C. Continuous lines represent models of experimental data (squares and circles) fitted with equation 4. (a) Samples in a group prepared with fine aggregates of small water absorption (A0, A1). (b) Samples in a group prepared with fine aggregates of intermediate water absorption (B0, B1). (c) Samples in a group prepared with fine aggregates of large water absorption (C0, C1)
Continuous curves represent the modeling function of Equation 4, obtained on non-linear fit with the algorithm of Levenberg and Marquart. Summations of equation 4 were restricted to 100 terms each to accelerate the calculations.
The adjusted parameters appear in Table 6. All modelled curves show concordance with the trend of the experimental data, as confirmed with small values of standard error S of regressions in Table 6. Parameter S indicates the maximum error achievable in predicting specific water absorption A performed with the models.
Regarding the applications of concrete matrices, two important parameters in Equation 4 of the model are relative absorption maximum A∞ and specific rate k of water absorption. As expected, all samples formulated with non-hydrophobic particles (A0, B0, C0) showed larger values of maximum specific water absorption A∞. Among these hydrophilic materials (without hydrophobic particle), a comparison of specific absorption rates k shows that the absorption capacity of the fine aggregates influenced the specific rate of absorption of the formulated concrete materials. This specific rate k of water absorption increased with the capacity of the fine aggregates (A <B <C) to absorb water. In contrast, k decreased with the hydrophobization of the matrix for each fine aggregate.
An addition of hydrophobic particles to materials clearly decreased the maximum specific absorption A∞. The trend of the absorption capacity of the fine aggregates (A <B <C) was maintained for the maximum specific absorption (A∞: A1 < B1 < C1). This finding indicates that, despite the hydrophobicity induced by the modified silica particles, the affinity of the fine aggregates for water maintained its effect.
Table 6. Fitted parameters of Equation 4 obtained on modeling experimental water absorption data of concrete samples; S represents the standard error of the regressions
|
Sample |
A∞ |
k / h-1 |
β/ h-1 |
γ / h-1 |
S |
|
A0 |
0.070 ± 0.002 |
8 ± 1 |
0.046 ± 0.007 |
0.048 ± 0.008 |
0.0017 |
|
A1 |
0.044 ± 0.002 |
5.3 ± 0.6 |
0.024 ± 0.004 |
0.035 ± 0.005 |
0.00071 |
|
B0 |
0.085 ± 0.001 |
17 ± 2 |
0.066 ± 0.01 |
0.026 ± 0.005 |
0.0016 |
|
B1 |
0.058 ± 0.001 |
8 ± 1 |
0.07 ± 0.01 |
0.08 ± 0.01 |
0.0016 |
|
C0 |
0.095 ± 0.002 |
24 ± 4 |
0.05 ± 0.01 |
0.017 ± 0.004 |
0.0018 |
|
C1 |
0.052 ± 0.002 |
9 ± 1 |
0.029 ± 0.005 |
0.042 ± 0.006 |
0.0010 |
These results of water absorption reflect an effect of the integral modification of concrete materials with hydrophobic particles. The hydrophobic silica particles relevantly adjusted the water absorption of the concrete materials regardless of the fine aggregates chosen for the formulations.
The process reverse of water absorption is drying. Drying dynamics (or drying kinetics) also help to evaluate the water-transport traits of assessed materials. The main parameter obtained from the experiments on drying kinetics is the specific drying rate.
In the experiments on drying dynamics, the mass of the initially water-saturated samples was recorded as a function of time t. Drying was conducted at constant temperature 25 °C and relative humidity 60 %. Under these conditions, the total amount of water contained in the samples did not evaporate, but the drying rate allows one to extract information about the transport of water through the material. Figure 5 shows the drying curves of the six prepared samples; the data were normalized with respect to each initial mass of the wet samples to obtain the relative mass mr. The relative mass data as a function of time t were fitted with a stretched exponential decay function,
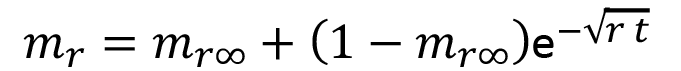 (5)
(5)
in which the initial relative mass of fully water-saturated samples (after curing for 28 days) is 1, mr∞ is the extrapolated relative mass of the sample after evaporation of the water (when equilibrium was attained under the specified ambient conditions) and r is specific drying rate. In general, a stretched exponential decay has form 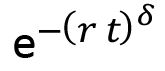 , in which δ is known as the stretching factor. For the drying dynamics fits in Figure 5, stretching factor 1/2 was used. The fitted parameters of Equation 5 that modeled the data in figure 5 are shown in Table 7.
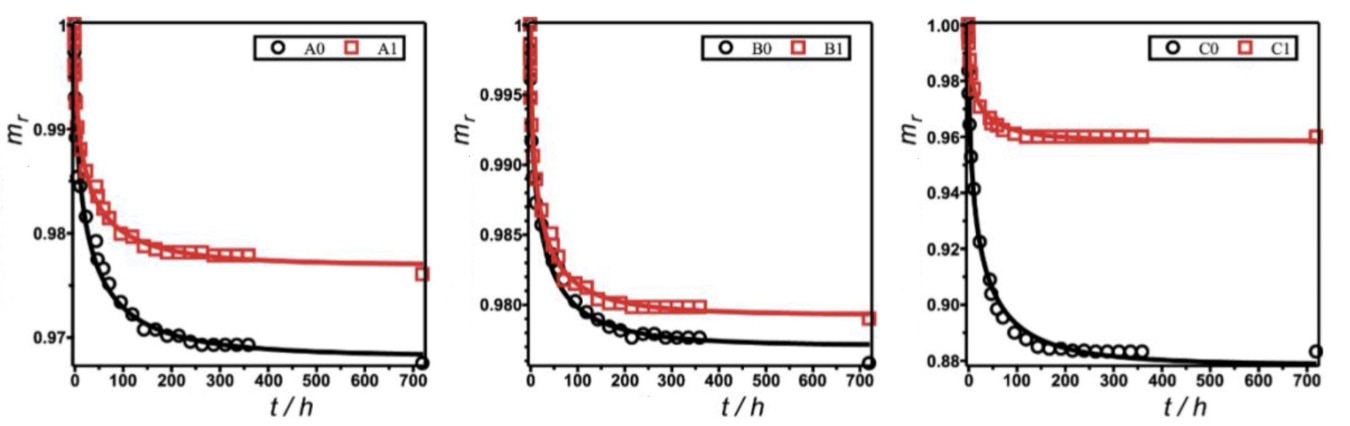
Figure 5. Drying kinetics of samples prepared with (a) fine aggregate A with small water absorption, (b) fine aggregate B with medium water absorption and (c) fine aggregate C with large water absorption. Labels 0 and 1 indicate that the samples were prepared with hydrophilic and hydrophobized concrete matrices, respectively. The solid lines represent fits of experimental data (circles and squares) with the function of Equation 5
Table 7. Fitted parameters of Equation 5 obtained on modelling the experimental data of the drying kinetics of concrete matrix samples prepared with fine aggregates A, B, C embedded in hydrophilic matrices (A0, B0, C0), or embedded in hydrophobized concrete materials (A1, B1, C1); parameter S represents the standard error of the regressions.
|
Sample |
mr∞ |
r/h-1 |
S |
|
A0 |
0.9682 ± 0.0005 |
0.037 ± 0.004 |
0.0010 |
|
A1 |
0.9769 ± 0.0003 |
0.039 ± 0.003 |
0.00057 |
|
B0 |
0.9771 ± 0.0003 |
0.045 ± 0.004 |
0.00070 |
|
B1 |
0.9793 ± 0.0002 |
0.050 ± 0.003 |
0.00047 |
|
C0 |
0.878 ± 0.001 |
0.045 ± 0.003 |
0.0032 |
|
C1 |
0.9585 ± 0.0005 |
0.058 ± 0.005 |
0.0013 |
These fits are generally satisfactory, as evident from the small values of standard error S of regression. According to those parameters, we inferred that, for materials prepared with fine aggregates, the trend of water affinity of the original aggregates (A < B < C) affected the water-release dynamics of the materials. Specific drying rate r decreased according to the inverse trend of water affinity. The decreased hydrophilicity then explained the increased rate of water release upon drying of the materials. This finding is consistent with the trend observed in the adsorption experiments.
Conclusion
The main finding of this work is that the water-transport traits of the fine aggregates used to prepare concrete materials affected the water-transport characteristics of the derived concrete materials. The induced trend of water absorption produced with the fine aggregates was maintained in the final materials. Sands with large water absorption or an unfavorable granulometry distribution produce materials with large water absorption, but the water absorption of concrete matrices decreases on formulating concrete materials with hydrophobic silica particles.
A detailed list of facts verified in the present study follows.
•Contact angles of all modified samples with hydrophobic silica particles exceeded 90°.
•Water absorption was significantly inhibited on the modification of concrete matrices prepared with commercial sands and functionalization with hydrophobic silica particles (decrement more than 30 % of water absorption with respect to the matrices without modification).
•The porosity and granulometry distribution of the commercial sands influenced the water absorption of the concrete matrices.
•The addition of hydrophobic silica particles decreased the water absorption of the derived concrete materials in all cases.
References
[1] S. Mindess, Developments in the Formulation and Reinforcement of Concrete. Kidlington, UK: Elsevier, 2019.
[2] Y. Ding and X. Ning, Reinforced Concrete. Beijing, China: Springer, 2022.
[3] A. Surahyo. Concrete Construction. Cham, Switzerland: Springer, 2019.
[4] W. Yang, The Issues and Discussion of Modern Concrete Science. Berlin, Germany: Springer, 2015.
[5] K. Janamian and J. Aguiar, Concrete Materials and Technology. London, UK: CRC Press, 2023.
[6] Z. Jiang, High-Performance Concrete with Manufactured Sand. Singapore, Singapore: Springer, 2023.
[7] G. de Schutter and K. Lesage, Active Rheology Control of Cementitious Materials. Oxford, UK: CRC Press, 2023.
[8] G. Gaganelis, P. Mark, P. Forman, Optimization Aided Design. Berlin: Germany, Wilhelm Ernst & Sohn, 2022.
[9] P. Hewlett, M. Liska, Lea´s Chemistry of Cement and Concrete. London, UK: Elsevier, 2019.
[10] A. Chaubey. Practical Concrete Mix Design. CR Press. New York, NY: 2020.
[11] R. Torrent, R. Neves, K. Imamoto, Concrete Permeability and Durability Performance. London, UK: CRC Press, 2022.
[12] Z. Li, X. Zhou, H. Ma, D. Hou, Advanced Concrete Technology. Hoboken, NJ: Wiley, 2023.
[13] S. Kosmatka, M. Wilson, Design and Control of Concrete Mixtures. Skokie, IL: PCA, 2016.
[14] A. Moulay-Alia, M. Abdeldjalila M., H. Khelafib, “An experimental study on the optimal compositions of ordinary concrete based on corrected dune sand—Case of granular range of 25 mm. Case Studies in Construction,” Materials, Vol.14, pp. 1-12, 2021. DOI: https://doi.org/10.1016/j.cscm.2021.e00521.
[15] M. Gou, B. Hu, F. Xing, X. Zhou, M. Sun, L. Sui, Y. Zhou, “Characterization of mechanical properties of eco-friendly concrete made with untreated sand and seawater based on statistical analysis. water absorption in concrete materials by modification with hybrid hydrophobic silica particles,” Construction and Building Materials, Vol.234, pp. 1-12, 2020. DOI: https://doi.org/10.1016/ j.conbuildmat.2019.117339.
[16] J. Kaufmann, “Evaluation of the combination of desert sand and calcium sulfoaluminate cement for the production of concrete,” Construction and Building Materials, Vol.221, pp. 210-218, 2020. DOI: https://doi.org/10.1016/j.conbuildmat.2020.118281.
[17] Z. Steyn, A. Babufem, H. Fataar, R. Combrinck, “Concrete containing waste glass, plastic and rubber as sand replacement,” Construction and Building Materials, Vol.269, pp. 1-9, 2021. DOI: https://doi.org/10.1016/j.jobe.2021.121242.
[18] E. Mora, G. González, P. Romero, E. Castellón, “Control of water absorption in concrete materials by modification with hybrid hydrophobic silica particles,” Construction and Building Materials, Vol.221, pp. 210–218, 2019. DOI:https://doi.org/10.1016/ j.conbuildmat.2019.06.086.
[19] ASTM (American Society for Testing and Materials), Standard Specification for Concrete Aggregates ASTM International. West Conshohocken PA, ASTM C33/C33M-18, 2018.
[20] ASTM (American Society for Testing and Materials). Standard Test Method for Relative Density (Specific Gravity) and Absorption of Fine Aggregate. ASTM International. West Conshohocken PA, ASTM C128-15, 2015.
[21] P. Schneider, “Adsorption isotherms of microporous-mesoporous solids revisited,” Appl. Catal. A: General, Vol.129, pp. 157–165, 1995. DOI: https://doi.org/10.1016/0926-860X(95)00110-7.
[22] ASTM (American Society for Testing and Materials). Standard Test Method for Compressive Strength of Hydraulic Cement Mortars (Using 2-in. or [50-mm] Cube Specimens). ASTM International. West Conshohocken PA, ASTM C109/C109M-16a, 2020.
[23] E. Mora, F. Castellón, “Anti-adherent molds yield hydraulic concrete samples suitable for assessments of surface and water absorption,” Journal of Civil Engineering and Construction, Vol.10 No4, pp. 245-252, 2021. DOI: https://doi.org/10.32732/jcec.2021.10.4.245.
[24] A. Stalder, G. Kulik, D. Sage, L. Barbieri, P. Hoffmann, “A snake-based approach to accurate determination of both contact points and contact angles,” Colloid, Surface, Vol. 286, pp.92–103, 2006. DOI:10.1016/j.colsurfa.2006.03.008.
[25] K. Walton and R. Snurr, “Applicability of BET Method for Determining Surface Areas of Microporous Metal-Organic Frameworks,” J. Am. Chem. Soc, Vol. 129, No27, pp. 852–856. 2007. DOI:https://doi.org/10.1021/ja071174k).
[26] H. Kibler, K. Carter. “Langmuir-type model for anomalous moisture diffusion in composite resins”. Journal Composite Materials Vol. 12 No 118, pp. 118-131. 1978. DOI:https://doi.org/10.1177/ 002199837801200201.
Declaración sobre uso de Inteligencia Artificial (IA)
Los autores aquí firmantes declaramos que no se utilizó ninguna herramienta de IA para la conceptualización, traducción o redacción de este artículo.
1 Sistema de Estudios de Posgrado, Universidad de Costa Rica. Costa Rica.
 ernesto.mora@ucr.ac.cr
 https://orcid.org/0000-0001-7966-8502
2 Escuela de Química y CICIMA, Universidad de Costa Rica. Costa Rica.
erick.castellon@ucr.ac.cr https://orcid.org/0000-0002-5888-8706