Automatic image segmentation using Region-Based convolutional networks for Melanoma skin cancer detection
Segmentación automática de imágenes mediante redes convolucionales basadas en regiones para la detección del cáncer de piel tipo melanoma
Karen Dayana Tovar-Parra1, Luis Alexander Calvo-Valverde2, Ernesto Montero-Zeledón3, Mac Arturo Murillo-Fernández4, Jose Esteban Perez-Hidalgo5, Dionisio Alberto Gutiérrez-Fallas6
Tovar-Parra, K.D.; Calvo-Valverde, L.A.; Montero-Zeledón, E.; Murillo-Fernández, M.A.; Perez-Hidalgo, J.E.; Gutiérrez-Fallas, D.A. Automatic image segmentation using Region-Based convolutional networks for Melanoma skin cancer detection. Tecnología en Marcha. Vol. 35, special issue. IEEE International Conference on Bioinspired Processing. December, 2022. Pág. 14-25. https://doi.org/10.18845/tm.v35i9.6479
Keywords
Melanoma; segmentation; machine learning; neural networks; medical image.
Abstract
Melanoma is one of the most aggressive skin cancers, however, its early detection can significantly increase probabilities to cure it. Unfortunately, it is one of the most difficult skin cancers to detect, its detection relies mainly on the dermatologist’s expertise and experience with Melanoma. This research deals with targeting most of the common Melanoma stains or spots that could potentially evolve to Melanoma skin cancer. Region-based Convolutional Neural Networks were used as the model to detect and segment images of the skin area of interest. The neural network model is focused on providing instance segmentation rather than only a box-bounding object detection. The Mask R-CNN model was implemented to provide a solution for small trained datasets scenarios. Two pipelines were implemented, the first one was with only the Region-Based Convolutional Neural Network and the other one was a combined pipeline with a first stage using Mask R-CNN and then getting the result to use as feedback in a second stage implementing Grabcut, which is another segmentation method based on graphic cuts. Results demonstrated through Dice Similarity Coefficient and Jaccard Index that Mask R-CNN alone performed better in proper segmentation than Mask R-CNN + Grabcut model. In both models’ results, variation was very small when the training dataset size changed between 160, 100, and 50 images. In both of the pipelines, the models were capable of running the segmentation correctly, which illustrates that focalization of the zone is possible with very small datasets and the potential use of automatic segmentation to assist in Melanoma detection.
Palabras clave
Melanoma; segmentación; aprendizaje automático; redes neuronales; imagen médica.
Resumen
El Melanoma es uno de los cánceres de piel más agresivos, sin embargo, su diagnóstico en una etapa temprana aumenta significativamente las opciones y el éxito en el tratamiento. Desafortunadamente, el Melanoma es uno de los cánceres de piel más difíciles de detectar, pues depende principalmente de la pericia y experiencia del dermatólogo. Esta investigación se enfoca en las manchas comunes que podrían evolucionar potencialmente a Melanoma. Se utilizaron redes neuronales convolucionales basadas en regiones como modelo para detectar y segmentar imágenes del área de la piel de interés. El modelo de red neuronal se centra en proporcionar segmentación de instancias en lugar de solo una detección de objetos delimitados por cajas. Se implementó el modelo Mask R-CNN con el propósito de proporcionar una solución para escenarios de pequeños conjuntos de datos entrenados. Inicialmente, solo se utilizó el modelo Mask R-CNN, luego se implementó Mask R-CNN y Grabcut: otro método de segmentación basado en cortes gráficos. Los resultados demostraron a través del coeficiente DSC y el índice de Jaccard que Mask R-CNN se desempeñó mejor en la segmentación que el modelo Mask R-CNN + Grabcut. En ambos modelos, la variación de los resultados fue muy pequeña cuando el tamaño del conjunto de datos de entrenamiento cambió entre 160, 100 y 50 imágenes. En ambas canalizaciones, los modelos fueron capaces de ejecutar la segmentación correctamente, lo que ilustra que la focalización de la zona es posible con conjuntos de datos muy pequeños y el uso potencial de la segmentación automática en la detección temprana de Melanoma.
Melanoma is cancer in the skin that occurs when the cells that give color to the skin (melanocytes) begin growing in an uncontrolled manner. Melanoma can develop in almost any part of the body, and it can spread very fast to other body areas [1]. Melanoma cancer incidence has grown considerably in the last few years worldwide, this might be concerning since it is one of the most aggressive forms of skin cancer [2].
Like many other diseases, its early detection and removal can significantly make a difference in the patient, greatly increasing the survival probability. However, recent medical advances identified Melanoma as a complex and heterogeneous disease that has a variety of genotypes and phenotypes (the way it looks), which represents a challenge for detecting early Melanoma [2].
This skin cancer detection relies upon the physician’s expertise and experience through a total body skin examination. During an examination is necessary a very bright light and different positions since this cancer have different features according to the anatomic site and the growth pattern such as symmetry, irregularity of borders, which varies by sex, race, and age. In this way, Melanoma detection depends mainly on qualitative observations [3].
This study aims to provide a complementary tool that supports the specialists whenever they are in the parameter recognition phase to detect Melanoma in the early stages. This research deals with targeting most of the common stains or spots that could potentially evolve to Melanoma skin cancer, more automatically by using Region-based Convolutional Neural Networks and segmentation methods based on graph cuts working directly on the picture of the stain to diagnose.
Region-based Convolutional Neural Networks:
To understand Region-based Convolutional Neural Networks, first, Convolutional Neural Networks (CNNs) should be defined. CNN’s are neural networks fed forwardly, that have several layers, in each layer occurs a transformation and calculation to the outputs of the previous layer. The neurons that make up the neural network have biases and weights, however, in CNN’s these are also organized in dimensions such as channels, width, height as well as the number of filters it has [4].
One of the most important characteristics of CNN is that its architecture expects an image as an input, this allows the network to have different layers such as the convolution layer, pooling layer, and fully connected layers and assign the weights to different parts of the image to differentiate one object from other [4] a diagram of a basic CNN is shown in the figure 1. Convolutional Neural Networks’ functionality relies on working in feature extraction and feature classification in the same learning body, they can process large inputs and they are flexible enough to work with different input sizes [5]. The CNN architecture represents an advantage in efficiency over previous models [5].
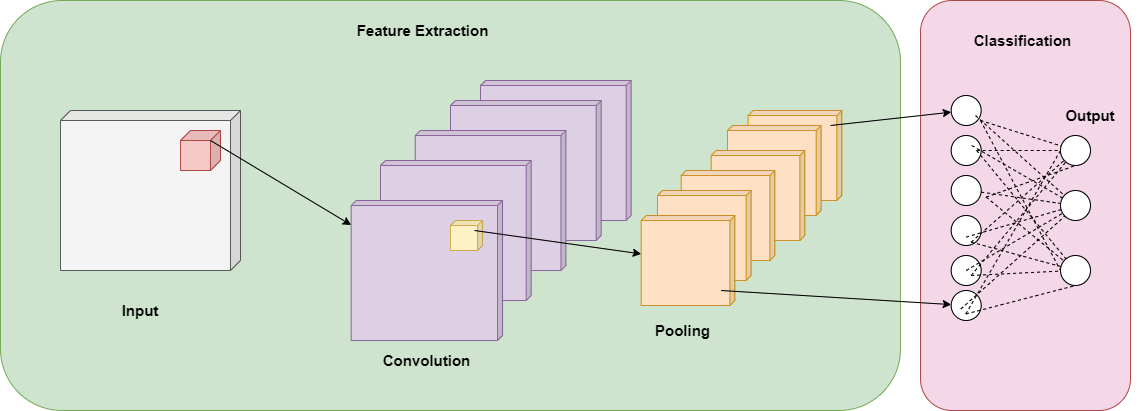
Figure 1. Basic Convolutional Neural Network (CNN) diagram.
CNN’s are usually used to classify the image as a whole, nonetheless, if the interest is to detect specific objects in the image, Region-based Convolutional Neural Networks (R-CNN) are the ones designed for this purpose [6]. R-CNN uses convolutional neural networks and adds a method using selective search to divide the image into two thousand different regions that act as proposals. Contrary to image classification, object detection requires locations in the image to work on, in this path R-CNN operates in these regions to classify each one using linear Support Vector Machines until the objects of the training are detected and recognized [7].
Materials and methods (methodology)
For Melanoma detection and segmentation, a total of 200 images from different patients with malignant melanoma were used. The images were obtained from The International Skin Imaging Collaboration (ISIC) archives specifically from the HAM10000 [8]. Image dimensions are 600 x 450 pixels in jpg format. Melanoma stains are from both women and men, and they are in different parts of the body such as the posterior torso, upper extremity, lower extremity, head, and neck. The number of images chosen correlates with the objective of demonstrating that few images can properly train the models to have accurate results in test images. Desirable results with a small training dataset open the door to the use of images from medical centers in which there are hundreds but not thousands of Melanoma study cases.
Dataset was divided randomly into two parts: the training dataset and the validation dataset. The training dataset had 80% of the images, this dataset was used to train the model. The 20% left was assigned to the validation dataset to make the tests and see how the model behaved.
For the training dataset, it was necessary to manually identify and label the images manually to have a ground truth, the manual segmentation and labeling were performed image by image using the Make Sense tool [9]. Labeling and segmentation of images had the supervision of field experts, images with the melanoma stain were masked by the clinician’s contour and were labeled as “Melanoma”.
In this investigation, two models were used: Mask R-CNN which uses Region-based Convolutional Neural Networks, and Grabcut which is a method that uses graph cuts. In the first part of the study, only the mask region-based convolutional neural network model was used.
For the first model, COCO weights [10] were used in h5 format. COCO stands for “Common Objects in Context”, it is a dataset that is used for object detection, segmentation, and captioning datasets. This dataset has weights that are the parameters used in the layers of the neural network, such as filter weights and biases. COCO has more than 330K images and more than one million object instances [10].
During the process, all images were dimensioned to 512 x 512. The model was set up with 2 classes: “Melanoma” and “Background”, the configuration also included 500 steps per epoch in the training, 5 validation steps during training, and the backbone used was Residual Network: ResNet50. The backbone is the network selected to extract the features from the model’s input. The output of the backbone is the input for the rest of the convolutional networks. The training dataset was transformed before the training into a Coco dataset alike since this is the one that the original neural network uses. The first output is the image with the color mask over the stain, however, to obtain the stain segmented the mask is applied to the original image using computer vision as can be observed in figure 2.
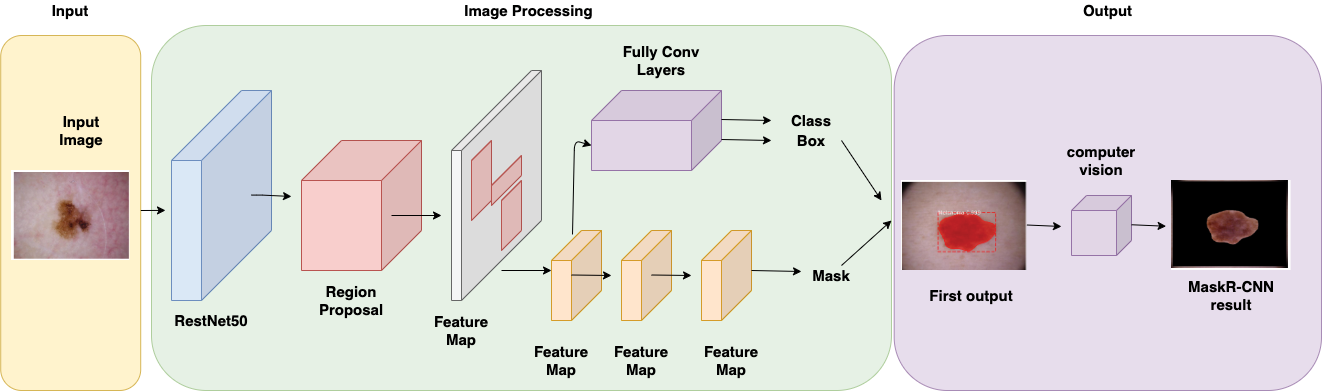
Figure 2. Mask R-CNN general architecture used in our research. RestNet50 was chosen as the backbone network and computer vision image processing is used in the output.
In the second phase of the investigation, Grabcut was introduced, as shown in figure 3. The algorithm was added to the pipeline to work with the outputs from the first model Mask R-CNN to make a foreground extraction and see if this could improve the pipeline results. Output from the first model was the segmented image with a black background, using Python’s computing vision library CV2, the mask was separated from the image leaving a mask with a black background and a white zone corresponding to the Melanoma shape. This was used as input to Grabcut which segmented a second time the image and generated a new mask using color similarity mapping.
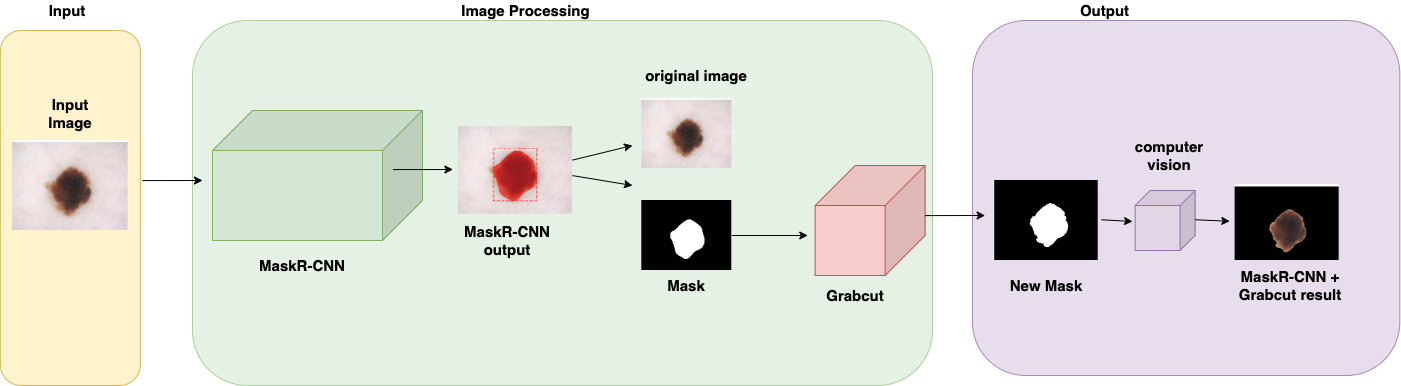
Figure 3. Pipeline architecture implementing Grabcut receiving Mask R-CNN mask output as an input.
Grabcut is a segmentation algorithm based on making graph cuts using the Gaussian mixture model to detect the foreground and the background on an image. The Gaussian Mixture Model translates the image to a graph that has both a source point and a sink point; these points are useful to recognize the pixel and the correlation between the pixels and the background and foreground [11]. Figure 4 shows the graph diagram.
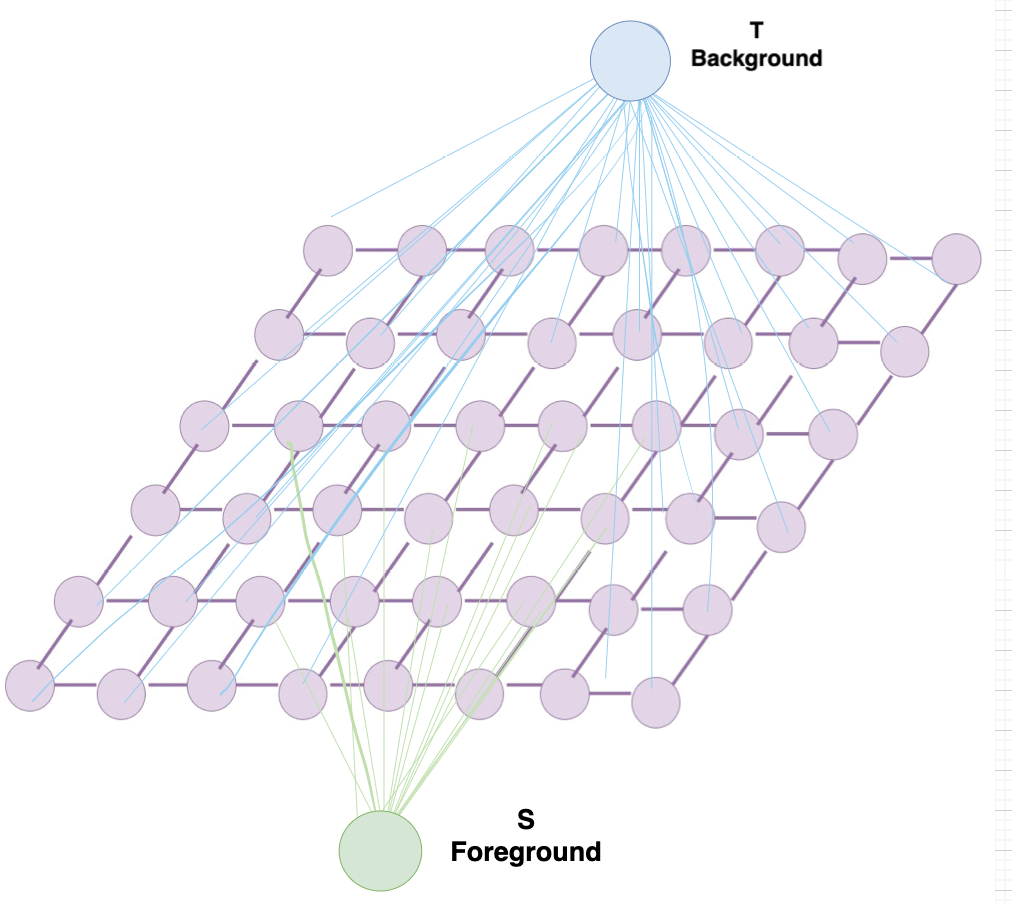
Figure 4. Graph diagram that Grabcut algorithm designs using the Gaussian Mixture Model.
The graph can be then converted to a function that receives a vertex, if the function has a result of 1, then the vertex is the source point, on the contrary, if the function has a result of 0, it means the vertex is a sink point [12]. Grabcut algorithm requires the user to provide as an input a selection of the area of interest in the image, the region outside the selected area is mapped as the background, whereas the region of the selected area is mapped as the unknown area, which later is classified in two sub-regions: background in the area of interest and the intended region. These two subregions are divided according to the maximum and minimum of the Gaussian Mixture Model, and in parallel, the parameters for the model are updated. The graph that was initially created is divided when the algorithm converges with the right parameters [11].
For both pipelines, three different training sessions took place by varying the quantity of the images in the training dataset. The three different stages were carried on with 50, 100, and 160 images, to see how affected the training dataset to the models and their behavior. This as mentioned, works in the line with the objective to demonstrate good performance with few training images. Having different groups varying the training dataset size allows this investigation to measure the impact of decreasing training images and the acceptable minimum limit of the training scope to make both models work successfully by making the automatic segmentation a support tool for medical professionals. This, for example, would also give an idea of the image quantity needed for training another melanoma type with this model.
Evaluation Metrics
The metrics used to evaluate both implementations were the Dice similarity coefficient (DSC) and the Jaccard Index. Both metrics work on overlapping to make a comparison between the resulting image with the ground truth. Equation (1) defines DSC:
Where:
•X: The ground truth. This is the image segmented manually in the zone the segmentation is wanted.
•Y: The result obtained. This is the image with the automatic segmentation performed by the model.
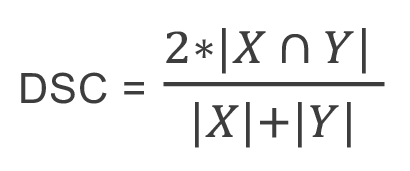 (1)
(1)
On the other hand, equation (2) defines the Jaccard Index:
 (2)
(2)
Both metrics are in a range between 0 and 1, the closest to 1 the similar to the ground truth.
Results obtained using Mask R-CNN alone and Mask R-CNN + Grabcut are shown in Table 1 and Table 2. Table 1 shows the middle value of both the Dice similarity coefficient and the Jaccard Index for the 40 images that were used to test both models, in Table 2 other measurements can be observed with both models and both evaluation metrics.
Overall, results show that Mask R-CNN alone has a DSC and a Jaccard Index closest to 1, and the standard deviation is highest in the model that implements Grabcut. The highest metric is the Dice Similarity Coefficient in Mask R-CNN with 0.923.
On the other hand, Table 3 presents the evaluation metrics obtained using different sizes in the training dataset in both models Mask R-CNN and Mask R-CNN + Grabcut. The dataset sizes are 50, 100, and 160 images. For Mask R-CNN the greatest difference between the different training datasets is 0.01 points in DSC and 0.018 in Jaccard Index. As well, for Mask R-CNN + Grabcut the biggest difference is 0.012 in the DSC and 0.014 points in Jaccard Index.
Table 1. General results of segmentation of Melanoma lesions.
|
Model |
Dice Similarity Coefficient |
Jaccard Index |
|
Mask R-CNN |
0.923 |
0.857 |
|
Mask R-CNN + Grubcut |
0.729 |
0.573 |
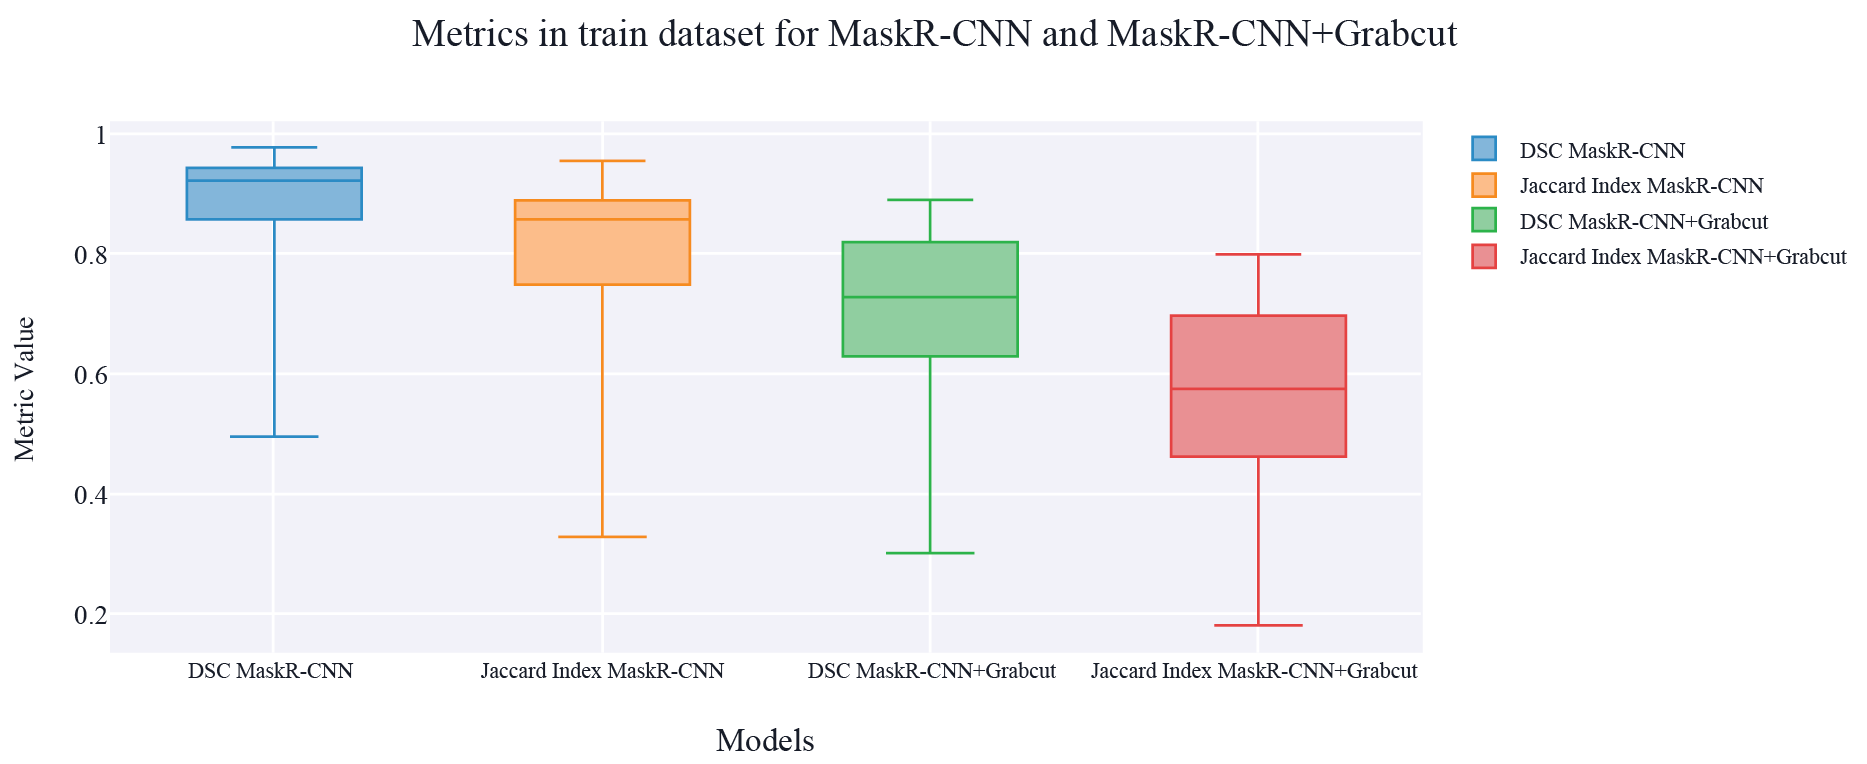
Figure 5. Results of Melanoma Segmentation for Mask R-CNN and MasR-CNN+Grabcut
Table 2. Detailed results of segmentation of Melanoma lesions including Mean, Median, and the Standard Deviation in the implementation of Mask R-CNN and Mask R-CNN + Grabcut
|
Model |
Dice Similarity Coefficient |
||
|
Mean |
Median |
Standard Deviation |
|
|
Mask R-CNN |
0.876 |
0.923 |
0.114 |
|
Mask R-CNN + Grubcut |
0.698 |
0.729 |
0.154 |
|
Model |
Jaccard Index |
||
|
Mean |
Median |
Standard Deviation |
|
|
Mask R-CNN |
0.795 |
0.857 |
0.153 |
|
Mask R-CNN + Grubcut |
0.554 |
0.573 |
0.163 |
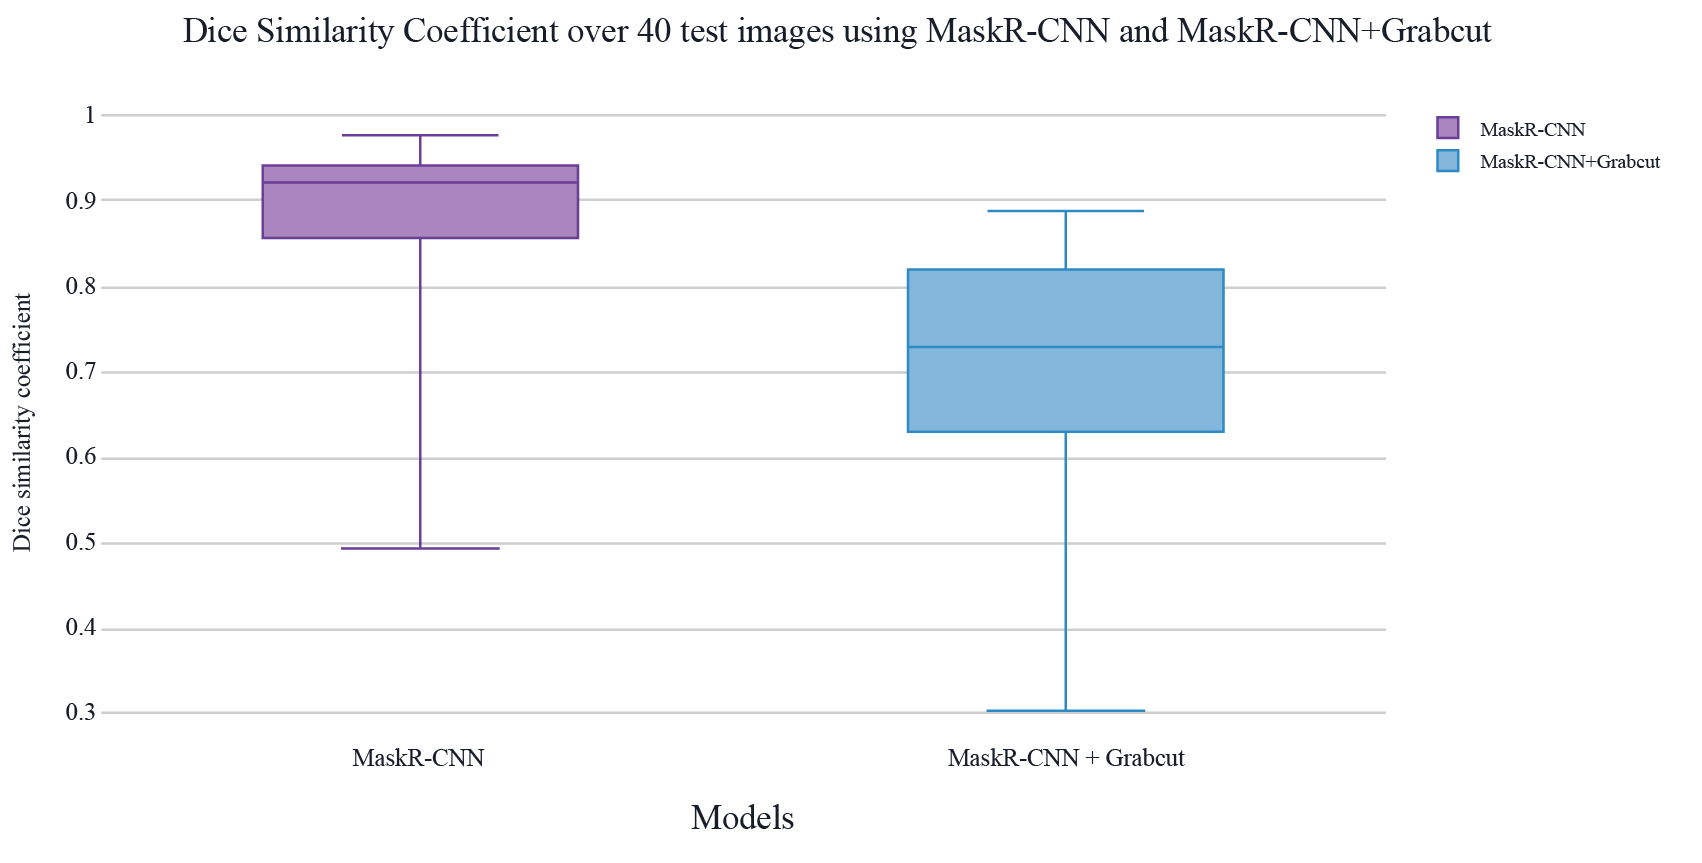
Figure 6. Dice Similarity Coefficient results from a comparison between Mask R-CNN and Mask R-CNN + Grabcut.
Table 3. General results of Melanoma segmentation using different-sized training datasets.
|
Model |
Dice Similarity Coefficient |
Jaccard Index |
|
Mask R-CNN 50 images |
0.913 |
0.839 |
|
Mask R-CNN 100 images |
0.922 |
0.856 |
|
Mask R-CNN 160 images |
0.923 |
0.857 |
|
Mask R-CNN + Grabcut 50 images |
0.717 |
0.559 |
|
Mask R-CNN + Grabcut 100 images |
0.718 |
0.560 |
|
Mask R-CNN + Grabcut 160 images |
0.729 |
0.573 |
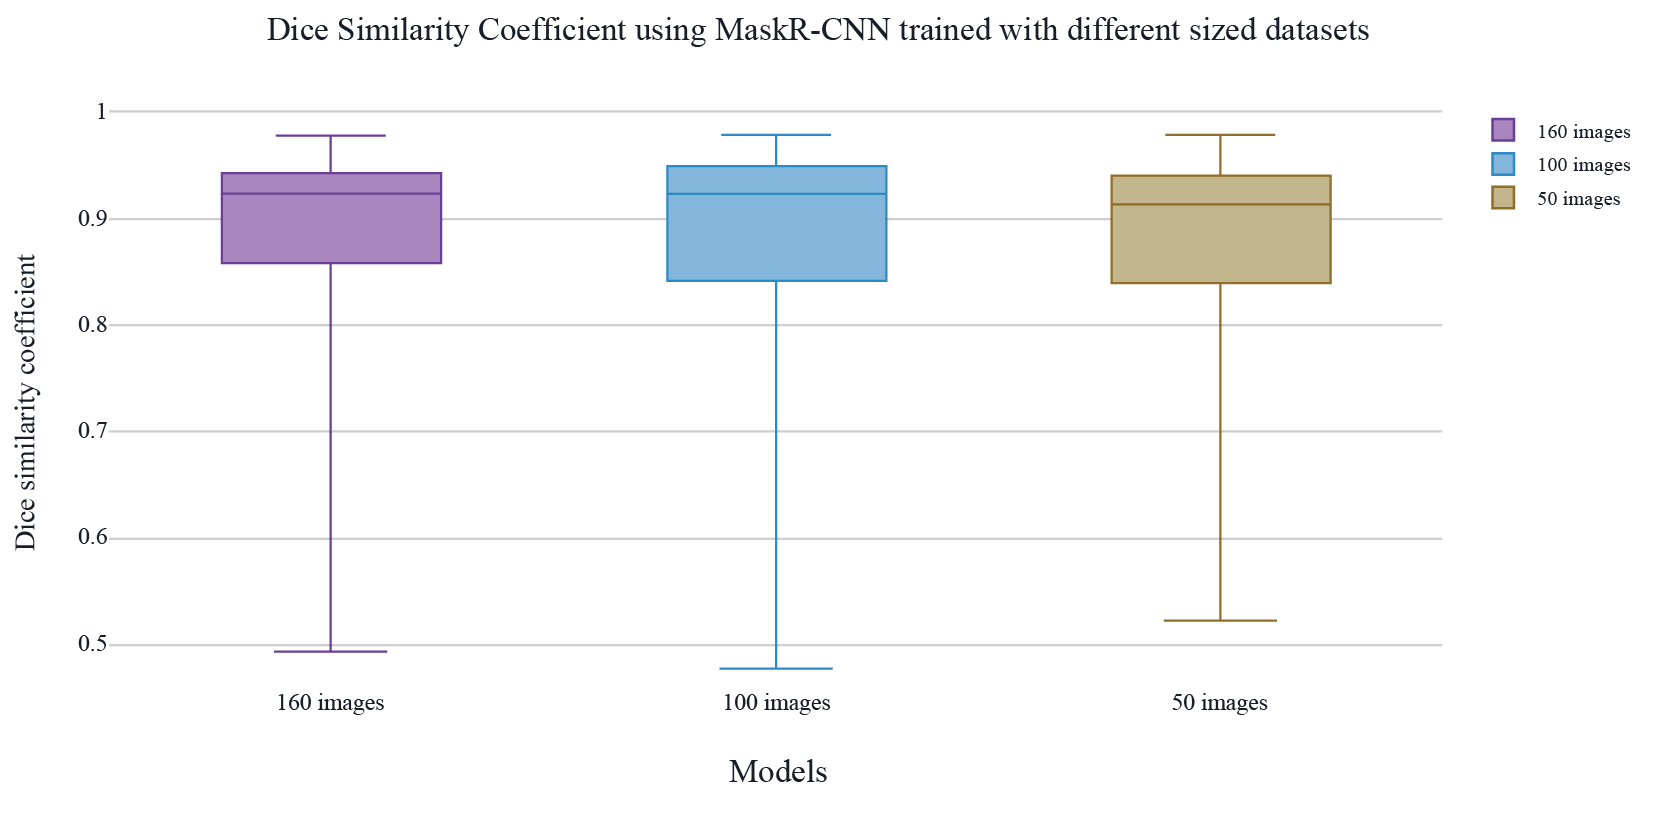
Figure 7. Results DSC metric in the segmentation using Mask R-CNN alone with different sizes in the training datasets (160, 100, 50 images).
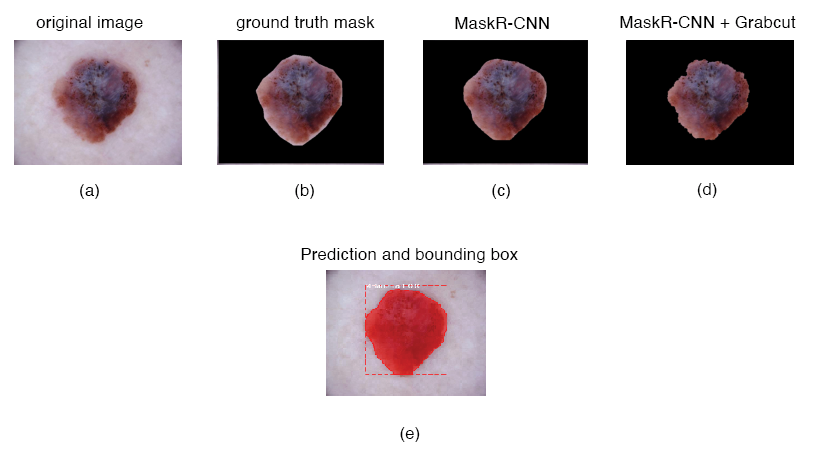
Figure 8. Melanoma segmentation results from one patient. (a) The original image; (b) ground truth segmentation; (c) mask region-based convolutional neural network segmentation; MaskR+CNN using Grabcut is shown in (d); Mask R-CNN prediction and bound boxing are shown in (e). For this Melanoma, DSC was 0.953 in Mask R-CNN and 0.821 with Mask R-CNN + Grabcut.
Results have showed that adding another layer to the pipeline using the Grabcut algorithm does not give better results, since as is observed in figure 4, DSC and Jaccard index metrics are higher for the pipeline that implements only Mask R-CNN , considering as well as presented in figure 7, the extra layer tends to take away the stain’s border in the segmentation, which is one of the ABCDs of melanoma used to properly detect a Melanoma cancer stain [2]. Mask R-CNN using RestNet50 was able to present a smoother segmentation, maintaining the borders and closest to the ground truth. Although in other experiments such as [11] Grabcut is used as an interactive method that could improve the segmentation, in this experiment the results showed that images segmented by a second layer using Grabcut algorithm have less border resolution, and for some cases, the border was eliminated by the segmentation, it also segmented the image with a more irregular frontier, which leads to a bigger non-common area with the ground truth mask of the images, that affected negatively the metrics. Less background in other case studies might be beneficial however it might not always be desired as the stain shape and border color are important in Melanoma detection.
In Figure 3 can be also observed how the results for DSC are dispersed in a bigger range in the case of the implementation with Mask R-CNN + Grabcut rather than the implementation only using Mask R-CNN, which points to less consistency when adding Grabcut.
Furthermore, with different training dataset sizes (50, 100, and 160 mages) the difference is not relevant as observed in figure 6, where the changes are over ± 0.015 points in the evaluation metrics, this states that Mask R-CNN with ResNet50 as the backbone can work properly even with few images in training such as 50 images and the segmentation keeps a high Dice Similarity Coefficient and Jaccard Index.
Both models were able to avoid the wrong detection in most of the cases by ignoring hair, small moles, and other pigmentation not related to the Melanoma, herewith it demonstrated the potential use of the automatic segmentation to assist the clinician in the Melanoma detection and delineation to extract it in pertinent cases.
This research results open up possibilities for future work such as using the segmentation to predict and classify different types of Melanoma and skin cancer based on shape and color structure. In addition, more work could be performed on looking for the right place in the pipeline to use Grabcut algorithm, including the creation of a new layer inside Mask R-CNN network that uses Grabcut instead of placing it at the end of the neural network results, so that the network can feed the Grabcut algorithm in the way it feeds Mask R-CNN results.
As well, an interesting approach would be to design the experiment to replace Grabcut with a second neural network especially another region-based convolutional network based on a U-Net architecture, making the output of the first RCNN the input of the second RCNN. Improving the results obtained in the experiment could also be approached from the preprocessing stage by applying contrast limited adaptive histogram equalization, applying the Single Image Haze Removal Using Dark Channel, and applying pseudo labeling to the test data. On the other hand for the loss function other metrics further than DSC and JSC could be used, such as the Weighted Boundary Loss which looks to reduce the distance between ground truth and the result segmentation, Lovasz which performs an optimization of the mean intersection over union and Center loss which penalizes distances between deep features and the class centers.
Acknowledgements
The authors would like to thank the Vicerrectoría de Investigación y Extensión at Instituto Tecnológico de Costa Rica for providing the occasion for this research.
[1] T. C. Mitchell, G. Karakousis and L. Schuchter. “Melanoma” in Abeloff’s Clinical Oncology, 6th ed. J. E. Niederhuber, J. O. Armitage, J. H. Doroshow, M. B. Kastan MD and J. E. Tepper, Eds. Elservier, 2020, ch. 66, sec. 3, pp. 1034-1051
[2] C. Garb et al., Cutaneous Melanoma. Springer, 2020, doi: 10.1007/978-3-030-05070-2
[3] H. L. Kaufman y J. M. Mehnert, Eds. Melanoma. Cham: Springer International Publishing, 2016, doi: https://doi.org/10.1007/978-3-319-22539-5
[4] J. Teuwen, N. Moriakov, “Convolutional neural networks” in Handbook of Medical Image Computing and Computer-Assisted Intervention. S. Zhou, D. Rueckert, G. Fichtinger, Eds. Academic Press, 2020, ch. 20, pp. 481-501, doi: https://doi.org/10.1016/C2017-0-04608-6
[5] S. Kiranyaz, O. Avci, O. Abdeljaber, T. Ince, M. Gabbouj y D. J. Inman, “1D convolutional neural networks and applications: A survey”, Mechanical Systems and Signal Processing, vol. 151, p. 107398, 2021, doi: https://doi.org/10.1016/j.applthermaleng.2014.05.008
[6] L. Chenning, Y. Ting, Z. Qian, and X. Haowei, “Object-based Indoor Localization using Region-based Convolutional Neural Networks,” 2018 IEEE International Conference on Signal Processing, Communications and Computing (ICSPCC), 2018, pp. 1-6, doi: https://doi.org/10.1109/ICSPCC.2018.8567795.
[7] R. Girshick, J. Donahue, T. Darrell, and J. Malik, “ Rich feature hierarchies for accurate object detection and semantic segmentation,” IEEE Computer Society Conference on Computer Vision and Pattern Recognition, 2014, doi: 10.1109/CVPR.2014.81
[8] Tschandl, P. “The HAM10000 dataset, a large collection of multi-source dermatoscopic images of common pigmented skin lesions”, vol 3. Harvard Dataverse, 2018, doi: https://doi.org/10.7910/DVN/DBW86T (2018)
[9] “Make Sense”. Make Sense. Available: https://www.makesense.ai/
[10] T. Lin et al. “Microsoft COCO Common objects in Contexts”. D. Fleet, T. Pajdla, B. Schiele B., T. Tuytelaars, Eds. Computer Vision – ECCV 2014. Lecture Notes in Computer Science, vol 8693. Springer, Cham, 201, doi:: https://doi.org/10.1007/978-3-319-10602-1_48
[11] G. Yao, S. Wu, H. Yang, S. Li. “GrabCut Image Segmentation Based on Local Sampling.” in Business Intelligence and Information Technology. BIIT 2021. Lecture Notes on Data Engineering and Communications Technologies, Vol 107. A. Hassanien, Y. Xu, Z. Zhao, S. Mohammed, Z. Fan, Eds. Springer, Cham, 2022, ch. 5, pp. 356-365, doi: https://doi.org/10.1007/978-3-030-92632-8_34
[12] D. Ren, Z. Jia, J. Yang and N. K. Kasabov, “A Practical GrabCut Color Image Segmentation Based on Bayes Classification and Simple Linear Iterative Clustering,” in IEEE Access, vol. 5, pp. 18480-18487, 2017, doi: 10.1109/ACCESS.2017.2752221.
1 Universidad de Costa Rica. Costa Rica. E-mail: karen.tovar@ucr.ac.cr https://orcid.org/0000-0003-1201-7195
2 Instituto Tecnológico de Costa Rica. Costa Rica. E-mail: lcalvo@tec.ac.cr https://orcid.org/0000-0003-3802-9944
3 Instituto Tecnológico de Costa Rica. Costa Rica. E-mail: emontero@tec.ac.cr https://orcid.org/0000-0002-4545-5805
4 Instituto Tecnológico de Costa Rica. Costa Rica. E-mail: mamurillo@tec.ac.cr https://orcid.org/0000-0002-6913-3472
5 Instituto Tecnológico de Costa Rica. Costa Rica. E-mail: jose.perez@tec.ac.cr https://orcid.org/0000-0001-7184-9974
6 Instituto Tecnológico de Costa Rica. Costa Rica. E-mail: dgutierrez@itcr.ac.cr https://orcid.org/0000-0001-7190-8858