Plantlia: app gratuita de Android para medición de área foliar y color con escalamiento automático
Plantlia: free android app for measurement of foliar area and color with automated scaling
Ovidio Valerio1
Valerio, O. Plantlia: app gratuita de Android para medición de área foliar y color con escalamiento automático. Tecnología en Marcha. Vol. 35, No 4. Octubre-Diciembre, 2022. Pág. 116-123. https://doi.org/10.18845/tm.v35i4.5777
Keywords
Image processing; Android; foliar area; automatic scaling.
Abstract
There is a plethora of apps available for different biological applications, however, mobile software for plant measurement, specifically for field conditions are limited. Additionally, there is a need to create large training datasets for machine learning applications. A free app called Plantlia, which is available to download from the Google Play Store, aims to resolve this with an intuitive interface, and a method to automatically scale images using homography. Plantlia also includes methods to share results from either direct measurements or thresholded images. This paper aims to describe some of the functions of Plantlia, as well as show scenarios that display its performance. Images from cellphones and drone pictures were used for validation on different devices. This is important, as it means that users with low-cost equipment, like drones with no GPS information, can still analyze localized field information. Similarly, researchers can do communal efforts to share and receive in-field data to create machine learning datasets.
Palabras clave
Procesamiento de imágenes; Android; área foliar; escalamiento automático.
Resumen
Hay una gran cantidad de apps disponibles para diferentes estudios biológicos, sin embargo, aplicaciones mobiles para la medición de plantas, específicamente para condiciones de campo, son limitadas. Además, existe la necesidad de crear grandes conjuntos de datos de entrenamiento para aplicaciones de aprendizaje automático. Una aplicación gratuita llamada Plantlia, que está disponible para descargar desde Google Play Store, tiene como objetivo resolver esto con una interfaz intuitiva y un método para escalar imágenes automáticamente usando homografía. Plantlia también incluye métodos para compartir resultados de mediciones directas o imágenes segmentadas. Este artículo tiene como objetivo describir algunas de las funciones de Plantlia, así como mostrar escenarios que muestran su desempeño. Se utilizaron imágenes de dispositivos móviles y de drones para su validación en diferentes dispositivos. Esto es importante, ya que significa que los usuarios con equipos de bajo costo, como drones sin información de GPS, pueden analizar información de campo localizada. De manera similar, los investigadores pueden hacer esfuerzos colectivos para compartir y recibir datos de campo para crear conjuntos de datos para aprendizaje automático.
Introduction
A very common practice that is used in biological sciences it’s to use image processing for botanical or microbiological applications. Additionally, there are many apps in the Google Play store that perform plant identification. While this is useful for many biological applications, many experiments are mostly dependent in quantifiable measurements. Due to this, the most common parameter that is in crop analysis is foliar area.
Due to the accessibility of open-source software, image processing in biology for this matter has become a trivial task. While many users use software like ImageJ [1], or the plethora of tools in the quantitative-plant website [2], this still involves keeping a considerably controlled environment. A common practice relies in hardware configuration from which images are transferred to a computer. Any scaling is performed manually, and if there is no scaling, percentages are used to derive areas in which there are anomalies, like the ratio of disease in a leaf.
This has led to many mobile applications that replicate this step. Apps like “Easy Leaf Area” have the ability to obtain filtered areas by color segmentation [3]. These areas are measured by pixel count to obtain area, and if possible, other parameters. For example, the “Plant Disease ver. 2.3” described in Nikos Petrellis work [4] uses this principle to determine percentages of diseased area.
This has also led to the creation of more complex solutions, based on machine learning algorithms. “Plant Screen Mobile” optimizes color segmentation using a genetic algorithm for parameter optimization [5]. While machine learning based apps are mostly used for plant identification [6], they all share the same limitation: many images must exist for training datasets.
Many users that work in biological sciences are not specialists in programming or any field related to computer science. They lack the ability to create advanced algorithms, many even have issues dealing with the balance of color spaces required for thresholding. Additionally, many experiments are more reliant on field data than small scale, leaf measurements.
Furthermore, all of the apps described in this paper share a common constraint, scaling is limited or non-existent. Many apps work only in pixel units. “Easy Leaf Area” claims to have an automated scaling method for red paper, which, still depends on the user defining a range for the red object, and can be affected by lighting and resolution.
Advances in modern hardware have allowed for more complex operations to be performed seamlessly. One of these is homography, which requires for the software to have previously defined keypoints. Lowe’s SIFT feature detector [7] is one of the best choices available [8]. Due to the expiration of its patent in 2020 [9], there are more choices available.
The purpose of this paper is to describe a free tool called Plantlia. The main focus of it is on accessibility, by keeping is user interface simple and truly automating image scaling using SIFT´s detector. Some of its calculations behind its thresholding will be displayed, as well as its functions.
Materials and methods
Plantlia is an android app built for APIs 21-30. It was written in Java using Android Studio. It´s main activity relies in Opencv for the image processing functions [10]. It is available on the Google Playstore and was tested on more than 10 different models during an open beta test. Figure 1 shows the steps of the image processing pipeline that was designed for with Plantlia. All of the steps will be described in detail in the next subsections.
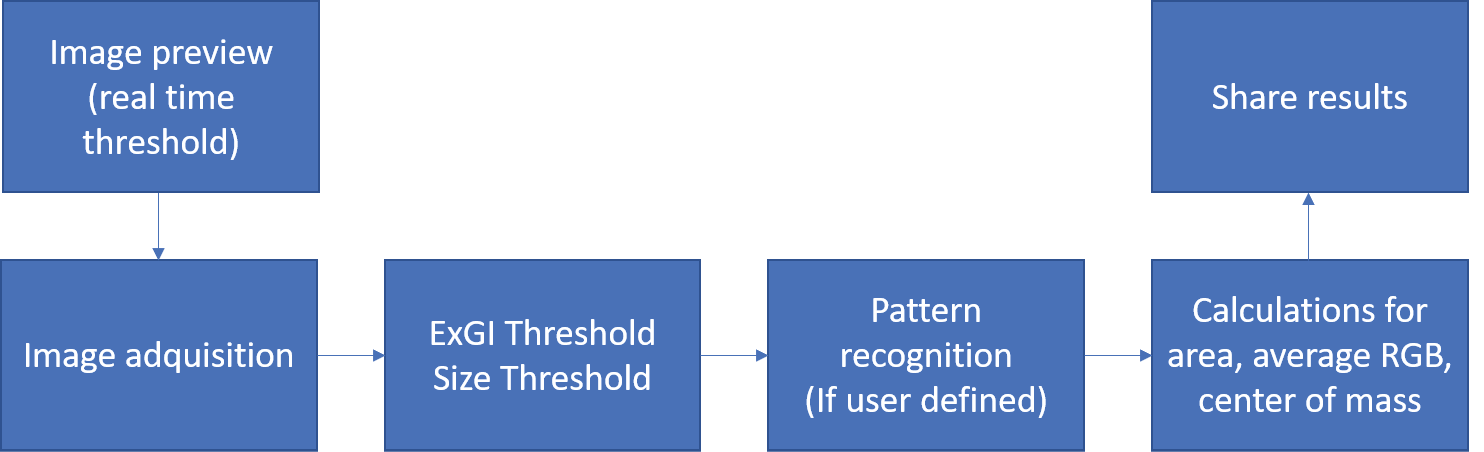
Figure 1. Image processing pipeline for Plantlia.
Image Preview and Acquisition
Once the app is started, user can see a preview that shows the frontal camera image. The user can perform real time thresholding; however, this functionality can be quite intensive for older devices (Less than 1 gigabyte of ram). Users can opt to not do any thresholding here and do it after taking an image. The description for the thresholding process will be explained later in this document.
Pressing the camera button takes a picture without flash, holding the camera button allows users to load images from gallery. This allows users to use the use images from other sources. Figure 2 shows the preview user interface.
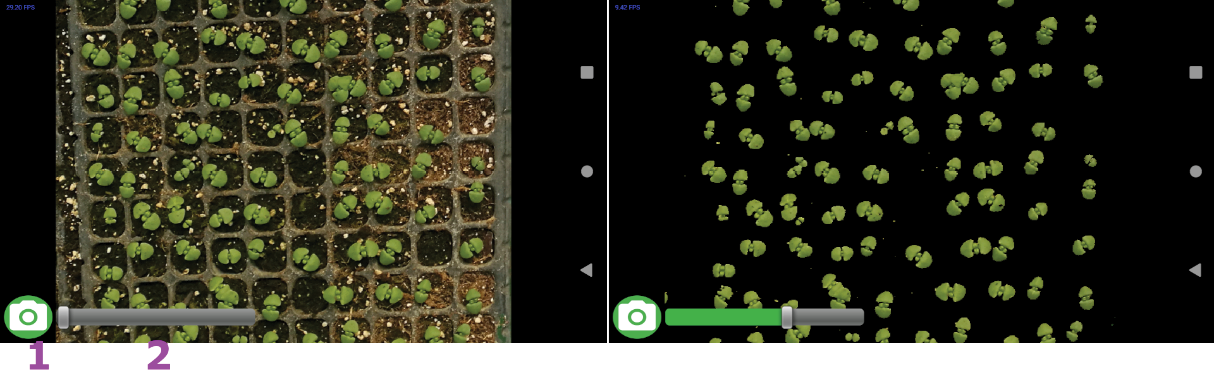
Figure 2. Image preview for real-time processing: 1. Camera button 2. Threshold slider.
Excess green and size thresholding
To facilitate the thresholding operations, instead of using complex 3 dimensional, multirange seek bars, Plantlia focuses only on the excess green index [11]. The formula is presented in equation 1, where G, R and B are green, red and blue channels, respectively.
 (1)
(1)
However, for convenience, this function is normalized using the minimum and maximum excess green values in the image. These values are mapped into a linear function to create a range of 0-255.
On the other hand, size thresholding is handled using the devices screen size as reference. User can filter objects by size, for which the filtering threshold keeps a normalized range of 0-255. This range represents objects that can have a size in pixels from 0 to ¼ the size of the screen. This is a practical way to filter experimental noise.
Because all of the thresholding functions are called asynchronously, the user can process images expediently, and filter objects before the scaling and data acquisition steps. Normally, in other pipelines the user has to input a minimum area in pixels, which is mostly known after getting results. This results in a slow iterative process to get known values, which isn’t needed here.
Automatic Scaling
To determine the scale of the image, homography is used to determine the relative size of an object with known dimensions. Plantlia, in its help window offers the users the link to download a pattern that can be printed. As long as the paper type is Letter, which is most commonly used in printers, dimensions should be correct. User can verify that the size is correct by using the square dimensions, which are 2.2 by 2.2 cm.
A combination of letters and square shapes was used, as it helps in the detection of the patterns position. The option to use the automatic scaling function is entirely optional, and the user can skip it altogether.
If the option to find scale was selected by the user, Plantlia will then proceed to try to find the pattern. To perform this, SIFT feature extractor and descriptors are used. The distance ratio proposed by Lowe [12] is used with a value of 0.8, and matching was done with FLANN [13]. If more than 14 matches where found, a homography matrix is calculated using RANSAC [14]Random Sample Consensus (RANSAC. The interface for the steps described in this section is shown in figure 3.
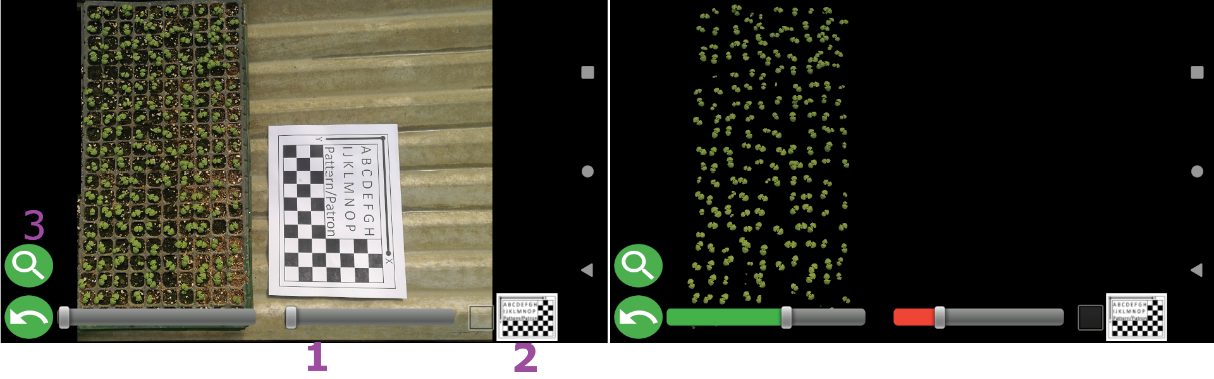
Figure 3. Processing interface: 1. Size slider 2. Pattern checkbox 3. View results button.
Results and exporting data
After the user presses the results button, the application will then start the object counting process. If the user had selected the pattern checkbox, Plantlia will try to find the pattern using homography, and use it to scale the results. Additionally, if the checkbox was selected, a new button will appear to show the results.
Plantlia shows the results in a scrollable table. This table however, can be shared using any method that the device natively would support. The results are then converted into a text string separated by tabs and new lines. This means that any program installed, be an email or messaging app, can be used to share data. Figure 4 Shows the results visualization.
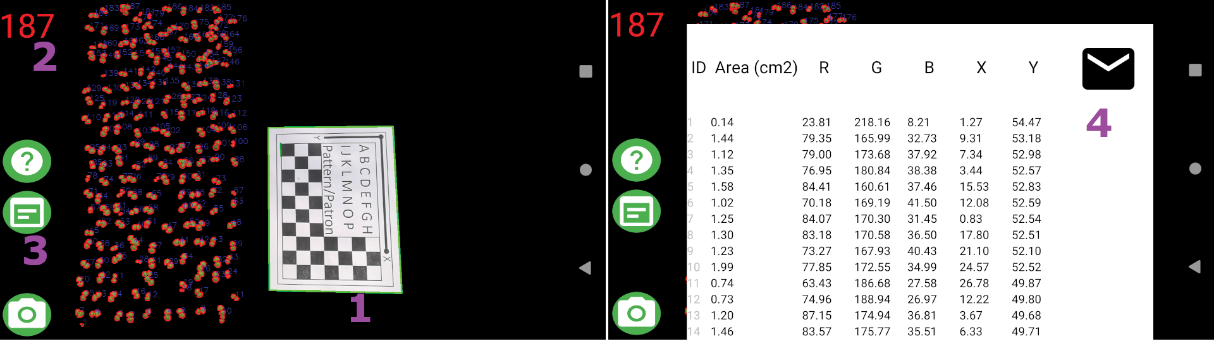
Figure 4. Results visualization: 1. Pattern found by Plantlia 2. Object count 3. Results table button 4. Share button.
Additionally, pressing and holding the results table button creates a thresholded image that is saved into the external folder and immediately shared. This option is particularly important for the creation of datasets for more complex algorithms. Users can collectively take and send processed pictures directly while looking for specific plant features, like diseases or pests.
Evaluation on multiple datasets
Plantlia was properly tested in several configurations of virtual devices with ram from 1-4 Gb. To further test Plantlia, images from different origins were processed on real hardware. These include a Samsung P9, Huawei P9, Google Pixel 4A and Pixel 5.
Pictures include: 10 images from drone imagery, 20 pertinent to in-field data from lettuce, chili and greenhouse crops in planters. This was performed during an open beta phase for the app, with community efforts.
Results
Devices with lower than 2 Gb of ram should not run the real-time segmentation, as they are bound to crash. Additionally, the maximum image size that can be loaded into Plantlia is defined by the maximum image cache, which is device dependent.
All images were loaded into devices with 1-4 Gb of ram without issues. Figure 5 illustrates these results. The only main issue that was found ocurred in greenhouse analysis, if the planters shared the same color as crops, segmentation would be unsatisfactory. Additionally, images from equipment with high resolution (4000 x 2000 pixels) can be loaded and analyzed. This is an important result that is mostly achievable due to modern hardware processing power.
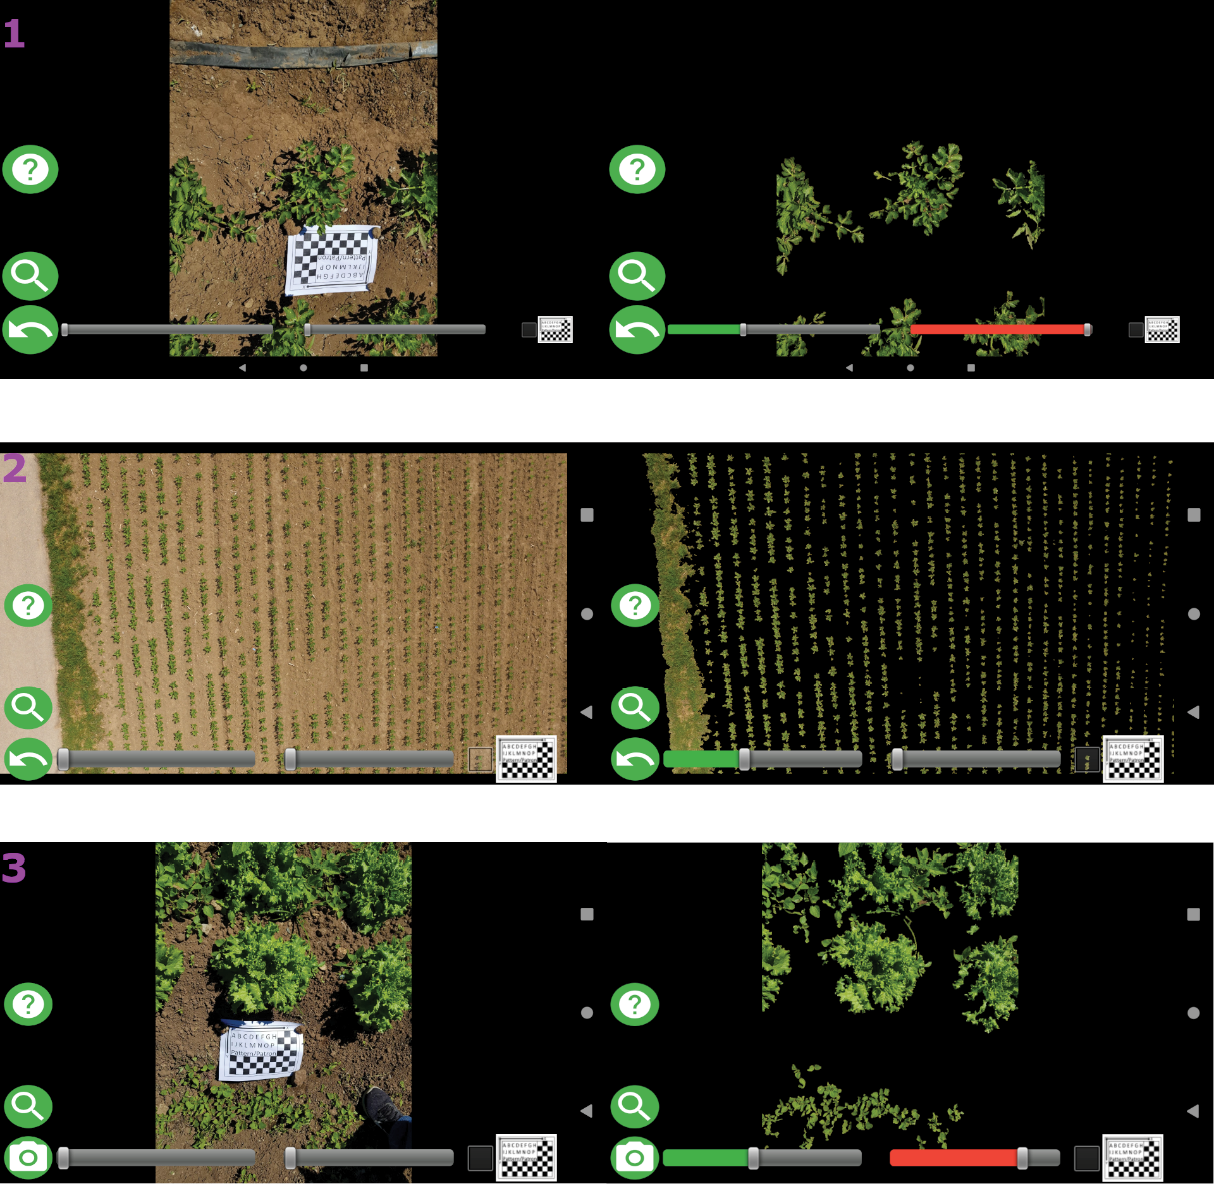
Figure 5. Plantlia in different scenarios: 1. Chili in field 2. Drone Image for beat 3. Lettuce in field.
Conclusions
In this paper, the capabilities of Plantlia where shown. Plantlia does not downscale images, and has an accessible and simple user interface. It can load images with very high resolutions from drone imagery. This is mainly possible due to the always continuous advances in hardware for mobile devices. This opens a new set of possibilities for users that don’t have access to high-cost equipment. Users can fly a low-cost drone, particularly, equipment that doesn’t possess GPS data to create orthomosaics, and instead, focus on a more localized solution.
Additionally, users can share results for very different applications. Plantlia can share direct measurements from the results table, or thresholded images. The second option is particularly useful for applications in machine learning, as it allows users to perform communal efforts to create datasets. Many machine learning applications have the problem that, outside their dataset, many algorithms fail to perform proper recognition for field conditions [15]. This of course, can be improved by using larger datasets, for which Plantlia can leverage some of the work.
Despite being free, Plantlia is not an open-source project. There is no interest in letting users manage source code, as other apps have become stagnant in this aspect. There is however, interest in adding features through updates through public feedback. For example, there are plans to add watershed segmentation [16] in a future update. Plantlia is available at https://play.google.com/store/apps/details?id=com.plantlia.
References
[1] J. Schindelin, C. T. Rueden, M. C. Hiner, and K. W. Eliceiri, “The ImageJ ecosystem: An open platform for biomedical image analysis,” Mol. Reprod. Dev., vol. 82, no. 7–8, pp. 518–529, 2015, doi: 10.1002/mrd.22489.
[2] G. Lobet, “Image Analysis in Plant Sciences: Publish Then Perish,” Trends Plant Sci., vol. 22, no. 7, pp. 559–566, Jul. 2017, doi: 10.1016/j.tplants.2017.05.002.
[3] H. M. Easlon and A. J. Bloom, “Easy Leaf Area: Automated Digital Image Analysis for Rapid and Accurate Measurement of Leaf Area,” Appl. Plant Sci., vol. 2, no. 7, p. 1400033, Jul. 2014, doi: 10.3732/apps.1400033.
[4] N. Petrellis, “A smart phone image processing application for plant disease diagnosis,” in 2017 6th International Conference on Modern Circuits and Systems Technologies (MOCAST), May 2017, pp. 1–4, doi: 10.1109/MOCAST.2017.7937683.
[5] M. Müller-Linow, J. Wilhelm, C. Briese, T. Wojciechowski, U. Schurr, and F. Fiorani, “Plant Screen Mobile: an open-source mobile device app for plant trait analysis,” Plant Methods, vol. 15, no. 1, p. 2, Dec. 2019, doi: 10.1186/s13007-019-0386-z.
[6] Z.-Q. Zhao, L.-H. Ma, Y. Cheung, X. Wu, Y. Tang, and C. L. P. Chen, “ApLeaf: An efficient android-based plant leaf identification system,” Neurocomputing, vol. 151, pp. 1112–1119, Mar. 2015, doi: 10.1016/j.neucom.2014.02.077.
[7] D. G. Lowe, “Distinctive image features from scale-invariant keypoints,” Int. J. Comput. Vis., 2004, doi: 10.1023/B:VISI.0000029664.99615.94.
[8] S. A. K. Tareen and Z. Saleem, “A comparative analysis of SIFT, SURF, KAZE, AKAZE, ORB, and BRISK,” in 2018 International Conference on Computing, Mathematics and Engineering Technologies (iCoMET), Mar. 2018, pp. 1–10, doi: 10.1109/ICOMET.2018.8346440.
[9] 293 DG Lowe - US Patent 6, 711 and U. 2004, “Method and apparatus for identifying scale invariant features in an image and use of same for locating an object in an image,” 2004.
[10] G. Bradski and A. Kaehler, “The OpenCV Library,” Dr Dobbs J. Softw. Tools, vol. 3, no. 1, 2000, doi: 10.1111/0023-8333.50.s1.10.
[11] A. Larrinaga and L. Brotons, “Greenness Indices from a Low-Cost UAV Imagery as Tools for Monitoring Post-Fire Forest Recovery,” Drones, vol. 3, no. 1, p. 6, Jan. 2019, doi: 10.3390/drones3010006.
[12] D. G. Lowe, “Object recognition from local scale-invariant features,” in Proceedings of the Seventh IEEE International Conference on Computer Vision, 1999, pp. 1150–1157 vol.2, doi: 10.1109/ICCV.1999.790410.
[13] M. Muja and D. G. Lowe, “FAST APPROXIMATE NEAREST NEIGHBORS WITH AUTOMATIC ALGORITHM CONFIGURATION,” in Proceedings of the Fourth International Conference on Computer Vision Theory and Applications, 2009, pp. 331–340, doi: 10.5220/0001787803310340.
[14] M. A. Fischler and R. C. Bolles, “Random sample consensus,” Commun. ACM, vol. 24, no. 6, pp. 381–395, Jun. 1981, doi: 10.1145/358669.358692.
[15] L. C. Ngugi, M. Abelwahab, and M. Abo-Zahhad, “Recent advances in image processing techniques for automated leaf pest and disease recognition – A review,” Inf. Process. Agric., vol. 8, no. 1, pp. 27–51, Mar. 2021, doi: 10.1016/j.inpa.2020.04.004.
[16] S. Beucher, “Watershed, Hierarchical Segmentation and Waterfall Algorithm,” 1994, pp. 69–76.
1 Plarepi. Costa Rica. Correo electrónico: ovidio@plarepi.com https://orcid.org/ 0000-0003-2299-0968