Article
DOI:
https://doi.org/10.18845/te.v19i2.7905
The influence of market orientation and new product development processes on new product success
La influencia de la orientación al mercado y los procesos de desarrollo de nuevos productos en el éxito de los nuevos productos
TEC Empresarial, Vol. 19, n°. 2, (May - August, 2025), Pag. 53 - 69, ISSN: 1659-3359
AUTHORS
Jorge Martínez-Lobatón *

Departamento Académico de Ciencias de la Gestión, Pontificia Universidad
Católica del Perú, Lima, Perú
jimartinez@pucp.pe.
![]()
Franco Riva-Zaferson
Departamento Académico de Ciencias de la Gestión, Pontificia Universidad
Católica del Perú, Lima, Perú
f.riva@pucp.pe.
![]()
Jean Pierre Seclen-Luna
Departamento Académico de Ciencias de la Gestión, Pontificia Universidad
Católica del Perú, Lima, Perú
jseclen@pucp.pe.
![]()
Corresponding Author: Jorge Martínez-Lobatón
ABSTRACT
Abstract
Since not all new products are introduced to the market successfully, the quality of the new product development process and its technical or market focus are of special importance. Many studies based on large companies in developed economies show that market orientation is a key factor for success. Despite this, little attention is still paid to this issue in developing economies. The purpose of this study is to analyze to what extent the success of new products depends on the rigor with which new product development processes are carried out and their market orientation. Using a dendrogram with the Ward’s linkage method on a sample of 140 manufacturing companies from Peru, three clusters of companies were identified. The clusters that report the greatest success are those characterized by superior quality and a strong technical orientation.
Keywords: NPDP, New Products, Market-Oriented, Technological orientation, Peru.
Resumen
Debido a que no todos los nuevos productos tienen éxito en su introducción al mercado, la calidad del proceso de desarrollo de nuevos productos y su enfoque en actividades técnicas o de mercado adquieren una importancia especial. Muchos estudios basados en grandes empresas de economías desarrolladas muestran que la orientación al mercado es un factor clave para el éxito. A pesar de esto, en economías en desarrollo, como las de los países latinoamericanos, todavía se presta poca atención a esta cuestión. El propósito de este estudio es analizar en qué medida el éxito de un nuevo producto depende del rigor con el que se llevaron a cabo las actividades de desarrollo de nuevos productos y su orientación al mercado. Utilizando un dendrograma con el método de vinculación de Ward para 140 empresas manufactureras del Perú, se identificó tres grupos de empresas. Los grupos que informaron el mayor éxito son aquellos que se caracterizaban por una calidad superior y una fuerte orientación técnica.
Palabras clave: PDNP, Nuevos Productos, Orientación al Mercado, Orientación Tecnológica, Perú.
Introduction
1. Introduction
Many studies indicate that the New Product Development Processes (NPDP) are becoming increasingly complex and risky due to the globalized market and the desire of customers for technologically advanced products. New products are the greatest source of competitive advantage for a manufacturing company (Geleilate et al., 2021); however, not all new products are successful in the market (Evanschitzky et al., 2012). Research on the success of new products is essential (Ledwith & O'Dwyer, 2009) because the failure rate, around 40% according to empirical studies (Castellion & Markham, 2013), prevents companies from improving their market share and value (Rubera & Kirca, 2012).
Researchers have generally adopted the hypothesis of the concept-product gap, which is the time it takes a company to progress from proof of concept to delivering a fully deployable product and implies a process of "bridging the gap", which is marked by uncertainties (Ng, 2021). This process has been deeply influenced by different models, depending on the activities considered. The use of a formal development process increases the effectiveness of the NPDP (Mabert et al., 1992). While adopting a structure is essential, this alone does not guarantee the success of a new product. In this process, each activity must be carried out with rigor (Cooper, 2019). Therefore, there is a strong relationship between the success of new products and the proficiency with which activities are executed at every stage of the process (Cooper & Kleinschmidt, 1986). Based on these arguments, is it a sufficient condition that all activities of the process must be done with rigor, or are the orientations of each activity very important as well?
These activities are mainly oriented toward the product's acceptance in the market, or the company's technical capacity to manufacture it. Some studies have proposed that the greater the market orientation in the NPDP, the greater the success (e.g., Najafi-Tavani et al., 2016; Narver et al., 2004; Ledwith & O'Dwyer, 2009). However, other studies have found that the activities in companies oriented towards technical capabilities tend to be carried out more proficiently than those oriented to the market (Cooper, 2019; Liu & Jiang, 2016). Consequently, a long-standing debate still exists regarding activity orientation in the NPDP (Noble et al., 2002).
Our study analyses to what extent a manufacturing company's success with a new product depends on the rigor with which the NPDP activities were carried out and their market orientation. This raises the following research questions: do these companies exhibit the same levels of quality and orientation in their NPDP? In other words, does the success of new products in these companies depend on the quality and the market orientation of their NPDP?
Most of these theoretical and empirical insights are mainly drawn from the experiences of large companies from developed economies where mature market mechanisms have already been established (Cooper, 2019). Developing economies like Latin American countries are very different from these economies. In any case, these issues have so far not been examined in the context of developing economies. Recent studies found that the Stage-Gate© model is especially relevant in the context of manufacturing companies in developing economies (Martínez-Lobatón & Seclen-Luna, 2023). Thus, our work suggests the need for further contextualization of these theories in Latin American countries. In this way, our contribution is to know if the manufacturing companies are market-oriented to successful new product development.
The empirical analysis uses a hierarchical cluster technique with the Ward linkage method and is based on a sample of 140 Peruvian manufacturing companies. Consistent with the work of Liu and Jiang (2016), the results illustrate the complexity of the managers' perception of the success of NPDP activities. Also, our findings reveal that in Peruvian manufacturing companies, the market orientation is not perceived as a critical factor to succeed in the NPDP. In a practical way, the findings suggest that in Peru, companies that emphasize the technical aspects of the NPDP may designate individuals with more rigorous training in project management to lead the process, which could contribute to their success.
The structure of the paper is as follows: The next section introduces the literature review on the new product development process, and this leads to the development of a hypothesis. The third section details the datasets and methods used in the study. The empirical results are provided in the fourth section. Finally, the fifth section provides some brief discussion, conclusions, and limitations of the study.
2. Literature Review and Hypotheses Development
2.1. New Product Development Process
In the literature of technological innovation, the concept-product gap is the time it takes an organization to progress from proof of concept to delivering a fully deployable product and implies a process of "bridging the gap" marked by uncertainties (Ng, 2021). Research and practice in the new product development process (NPDP) have been deeply influenced by different models depending on the activities considered in the process. Currently, several models can be useful for analyzing the NPDP, such as the New Product Development Ability (Panizzon et al., 2021) or hybrid approaches (Gomes et al., 2022). One of the most practical is the Agile Model, which has been increasingly adopted by companies in recent years (Bianchi et al., 2020). Companies that adopt Agile models combined with digital technologies become more competitive. For instance, early adopters of artificial intelligence (AI) in NPDP, report significant benefits (Zhang et al., 2021). However, not all companies are at the same stage in their AI adoption process and its application has yet to materialize (Cooper, 2023; Cooper & McCausland, 2024).
The conventional NPDP proposed by Cooper and Kleinschmidt (1995) was a structured process with well-defined decision criteria from idea generation to product launch, called "Stage-Gate©". This model remains predominant (e.g., Atuahene-Gima et al., 2005; de Brentani, 1989; Mu & di Benedetto, 2011; Narver et al., 2004; Zhang & Duan, 2010) and has deeply influenced both practice and research (Salvato & Laplume, 2020).
The Stage-Gate© model follows a structured process involving various activities organized into planned stages to minimize uncertainty (Gaubinger et al., 2015; Ulrich & Eppinger, 2016) and is a critical determinant of new product success (Cooper, 2019; Salerno et al., 2015). Empirical research highlights that the use of a formal development process with clearly defined stages and gates increases NPDP effectiveness (Mabert et al., 1992).
Some studies question the value of Stage-Gate© in today's increasingly uncertain and fast-paced environments, citing issues such as excessive rigidity, bureaucracy and delays (Lenfle & Loch, 2010). However, this model is especially relevant in the context of manufacturing companies in developing economies (Martínez-Lobatón & Seclen-Luna, 2023), which cannot afford to fail and therefore needs extensive financial support.
The Stage-Gate© model proposes that the NPDP consists of five stages, in which 18 key activities are developed (Table 1). According to Cooper (2017), the first stage, "scoping or speed evaluation," includes a preliminary assessment of the market, the company's technical capabilities, and the economic-financial viability of the new product. Evidence suggests that these preliminary activities are crucial (Dziallas, 2020) as they help reduce significant technical and market uncertainties regarding the product. In the second stage, "building the business case or detailed evaluation", market research, technical-productive evaluation, legal evaluation, and financial analysis is conducted. Evidence has shown that, in some cases, companies choose to skip these activities due to time or cost constraints, which, in turn, leads to the failure of the product launch (Martínez-Lobatón & Seclen-Luna, 2023).
Table 1 PDNP - Stages, activities, and orientation
Source: Own elaboration fromCooper (2017)
The third stage, "development or working with a prototype", includes prototype development, prototype testing, development of the manufacturing process, and financial analysis of the business. Therefore, the creation of the new product is expected to be validated, for which the technical capabilities of the company become very important, as well as the financial numbers that will support the decision. The fourth stage, "testing and validation or final tests", includes production tests and market tests, as well as a conclusive financial analysis of the business. Here, consumers become partners in cocreation, and not mere objects of study (Roberts et al., 2022). Finally, the fifth stage, "launch", includes the production and the promoted launch of the product.
In this process, each activity, which must be carried out with rigor, is oriented towards a) the evidence of the acceptance of the product in the market, or b) the technical capacity of the company to manufacture it, or c) the financial or legal viability of the project. The orientations of each activity are added to Table 1.
2.2. Quality in the execution and orientation of NPDP activities.
The contingency theory suggests that there is no single best way to structure an organization and that there is more than one way to manage innovation development (Cubric & Li, 2024). While adopting the NPDP structure is essential, it does not on its own guarantee the success of a new product. The approach taken depends on various environmental factors, including the market, technologies, time, budget, and stakeholders (Salerno et al., 2015). It is equally critical to address specific factors that, if overlooked, can lead to the failure of the product upon entering the market (MacCormack & Verganti, 2003). Some of these factors can be related to the success of new product development and in particular, can be associated with the proficiency or quality of execution of NPDP activities at each stage, information acquired, market knowledge, market orientation, initial screening, proficiency of pre-development marketing and technical activities, proficiency of marketing and technical activities in other stages, and the intensity and characteristics of customer involvement (Cooper, 2019).
While all the stages mentioned encompass essential activities, research on this topic has shown that the early stages of the NPDP are often executed with insufficient proficiency (Alvarado-Alarcón et al., 2018; Cooper, 2017; Seclen-Luna & López-Valladares, 2020). This is particularly significant, as there is a strong correlation between the success of new products and the proficiency with which activities are executed at every stage of the process (Cooper & Kleinschmidt, 1986). "Get it right the first time" is an old saying that refers to the fact that poor quality execution in any activity can result in significant losses due to the need for later corrections. For some decades now, the causes of new product failures have been identified, highlighting major deficiencies in how activities were executed. Therefore, not only are some activities more important than others, but also, the quality of the execution of all the activities in each stage "makes the difference" to the performance of the new product (Cooper, 2019).
In addition to the quality of activity execution during the different stages, pioneering research showed that initial market, and not initial technical, activities of the NPDP-initial market evaluation, initial assessment, and market research-were poorly executed in 73% of the projects analyzed. Additionally, 54% of the projects had weak product launches, and 49% of the products tested showed deficient testing (Cooper & Kleinschmidt, 1995). Thus, based on this empirical evidence, some studies found that the technical activities of companies tend to be carried out more proficiently than those oriented to the market (Cooper, 2019). It is acknowledged that technical capabilities entailing the leveraging of existing knowledge and resources to introduce novel products via screening, integrating, and reconfiguring (Subramaniam & Youndt, 2005), have been demonstrated to be vital for the NPDP. In fact, technical capabilities have a significant influence on the new product development performance and product competitiveness (Liu & Jiang, 2016). The extant literature recognizes R&D as one of the main determinants of technological capabilities since it plays a fundamental role in developing new competencies and skills necessary to seek, acquire, and adapt the existing technology (Chudnovsky et al., 2006). Unfortunately, Latin American and Caribbean (LAC) countries have historically recorded low R&D investment in the productive sector (ECLAC, 2022; Seclen-Luna & Morales, 2022). The literature criticizes the LAC context because non-technological or basic commodity activities dominate this region (Cuervo-Cazurra et al., 2019).
In line with the last argument, the importance of carrying out high-quality market-oriented activities in the NPDP is highlighted. Extensive literature supports the findings of Cooper (2019) that a consistent market orientation (MO) throughout the entire process is a key factor for the success of the NPDP (Grunert & Van Trijp, 2014; Najafi-Tavani et al., 2016; Reid & Brady, 2012). It is for this reason that MO is usually associated with the introduction of new products into the market (Atuahene-Gima et al., 2005; Rodríguez-Pinto et al., 2011).
As a restricted conception, MO focuses on the future needs of customers, the diffusion of that knowledge, and the company's response (Kohli & Jaworski, 1990). As a broader concept, MO is related to both, customer and competitor knowledge, and the coordination between business functions associated with that knowledge (Narver et al., 2004). These two components have a direct, yet variable, influence on the NPDP. Among them, customer orientation stands out, due to its significant impact, being recognized as the core of market orientation. Even so, it should not be overlooked that success in the NPDP is driven by cooperation between R&D and Marketing (Kam & Tong, 2012). Based on these arguments, we formulate the following hypotheses:
Hypothesis 1 (H1): Companies with a higher market orientation of their NPDP activities are more successful in developing new products than those that are more technically oriented.
Methods
3. Methodology
3.1. Data and sample
Although the Peruvian National Institute of Statistics and Informatics carries out the National Innovation Survey every three years in the Manufacturing and Knowledge Intensive Business Services Industries of Peru, much of the data collected does not specifically include information about the NPDP. Moreover, there are few studies that analyze the NPDP in Peruvian companies (Seclen-Luna & Ponce-Regalado, 2020). One of the main barriers to conducting studies in Peruvian companies is the lack of databases with up-to-date contact information. Therefore, this study follows the top 10,000 companies with the highest sales in Peru in 2017 (Cavanagh, 2017). This annual ranking has been used in previous studies on management issues that have been published in international journals, such as the one by Martínez-Lobatón and Seclen-Luna (2023), among others.
The study focuses on manufacturing because it is one of the most productive sectors in Peru, contributing 13.3% to the economy's added value in 2019. It is the single most productive sector, followed by the mining industry with 12.4% (INEI, 2021). Additionally, the study was limited to the Lima and Callao regions, as about 60% of Peruvian manufacturing companies are located there (INEI, 2021). A total of 817 medium-sized manufacturing companies were identified and established as the population for the survey.
The information was collected from February to May 2019; phone calls were made, followed by email communications through which questionnaires were sent to individuals knowledgeable about the company's New Product Development Process. As a result, the respondents held positions as Functional Line Managers (38%), Area Managers (23%), and General Managers (19%). Respondents were specifically from the Commercial (26%), General Management and Support (21%), Operations (15%), Marketing (13%), and General Administration (8%) areas. Therefore, the composition of the respondents was consistent with previous studies (e.g., Tyler & Gnyawali, 2002).
The questionnaire was based on previous studies (e.g., Cooper & Kleinschmidt, 1986; Cooper, 2017 & 2019) and included questions regarding (i) the context of the organization, (ii) the number and quality of NPDP activities carried out, and (iii) the success of new products launched on the market. A total of 148 questionnaires were received, of which 140 were valid, yielding a response rate of 17%. This rate is similar to previous studies on the success of new product development (e.g., Millson & Wilemon, 2019). Additionally, the companies in the sample belonged to 13 sectors. The five sectors from which the most responses were received were Metalworking (24%), Food Products and Beverages (21%), Chemical Substances and Products (19%), Textiles (14%), and Rubber and Plastics (11%). These percentages aligned with the overall proportion of companies in each sector within the total population of medium-sized Peruvian manufacturing companies.
3.2. Variables and scales
3.2.1. Dependent variable
In this study, the dependent variable is the success of the new product. The overall level of success is an indicator that reflects the perception managers have about the success achieved and can be understood as the satisfaction derived from comparing expectations with outcomes (Parasuraman et al., 1988). To measure this variable, respondents were asked on a 5-point Likert scale, where 5 was "much more than expected" and 1 was "much less than expected" "What is your perception of the new product's success compared to the expectations it generated?". This method of measuring managerial perceptions has been used in previous studies, as seen in Powell et al. (2006), and it is useful for understanding how managerial experience influences their perception of the effects of innovation (Martínez-Lobatón & Seclen-Luna, 2023).
3.2.2. Independent variables
This study considered each NPDP activity as an independent variable, and respondents were asked on a 5-point Likert scale, where 1 was "very poorly done" and 5 was "very well done" "How adequately do you think each activity was performed?". This method of measuring managerial perceptions has been employed in previous studies, including those by Cooper and Kleinschmidt (1986), and is useful for understanding how managerial experience influences the perception of the quality of decisions and the success of the company's new products (Kunc & Morecroft, 2010).
3.3. Methods and test
In accordance with our research objectives, the hierarchical cluster technique was applied with the Ward linkage method and the chi-square count measure, because of the ordinal nature of the variables. This method was recommended by Xu and Wunsch (2008), as it measures the relationships between categorical variables in a contingency matrix using the chi-square test. The hierarchical cluster technique enabled these groups to be visualized in an understandable way, which is useful for identifying patterns and relationships in the data.
Chi-square grouping is particularly useful when working with categorical or nominal data, which was the case in this research. An additional advantage of hierarchical clustering is that it allows the exploration of different levels of grouping. The number of clusters was determined through visual analysis of the dendrogram and, following the recommendations of Dash et al. (2003), by identifying the maximum clustering distances with the fewest possible clusters. The assignment of each observation to its respective cluster was then determined using the software's built-in assignment algorithm. Data analysis was performed using SPSS software, version 25.
To determine the most important variables for classification in each cluster, tree regression was applied using the CHAID method for growth analysis, following the recommendations of Song and Lu (2015). A cross-validation was performed with 1000 sample folds, and it was determined that the maximum partition could be performed with 10 cases in the parent node and 5 cases in the child node. A significance level of 0.05 was used in the chi-square tests for node division, and the significance values were adjusted using the Bonferroni method. The profiles of each cluster were then determined descriptively, based on the findings of this stage. To test H1, the association between cluster and subsector variables was evaluated using a chi-square analysis.
Results
4. Results
4.1. Descriptive analysis
Descriptive analysis shows that Means tend to be higher for clusters 1 and 3, with lower Standard Deviation in cluster 1, showing a more consistent performance among these companies (Table 2). This, however, does not mean that they should outperform cluster 3, as further statistical analysis is required to assess the relative importance of each variable against the self-reported success.
Table 2 Descriptive by cluster
4.2. Cluster analysis and regressions.
The cluster analysis, based on the evaluation of the dendrogram, revealed the existence of three clusters in manufacturing companies. The number (frequency) of observations per cluster is shown in Table 3, both in nominal and percentage terms. The dendrogram that illustrates the cluster membership determination and the selected cutoff point for this research, following Dash et al.'s (2003) criteria, is available upon request. Interested readers may contact the authors for further details.
Table 3 Clusters in the medium-sized manufacturing companies in the sample
| Cluster | Frequency (number) | Frequency (percentage) |
|---|---|---|
| 1 | 19 | 13.6 |
| 2 | 62 | 44.3 |
| 3 | 59 | 42.1 |
| Total | 140 | 100.0 |
Subsequently, once the cluster memberships were assigned, a tree regression analysis was carried out using the CHAID method. The results of this analysis, shown in Figure 1 helped determine the cluster profiles by characterizing them based on the observed results. The CHAID analysis revealed that the most important variable for classification was the importance of external prototype testing with customers. This partition revealed that a significant group of companies did not conduct prototype testing with customers, while others did so to varying extents. In cluster 2, 48 out of the 52 companies, did not perform these activities. Additionally, in this same cluster, it was observed that these companies are relatively small, as they ranked below the top 2000 in 2016. Another important characteristic of cluster 2 is that production testing was not relevant. Thus, it can be concluded that there is a low level of both market orientation and technical orientation in these companies.
The other two partitions revealed that cluster 1 (in blue in Figure 1) focused on market-oriented activities such as prototype testing, market research, and customer testing. In contrast, cluster 3 (in green in Figure 1) focused more on legal requirements, prototype testing, and production testing, indicating a technical orientation. Therefore, it was possible to determine the typical behavior of the clusters and classify them according to their quality and orientation, as shown in Table 4. It was found that there were (a) two levels of quality in NPDP management, measured by the number of activities completed and the rigor with which they were performed, and (b) two orientations, determined by the type of activities carried out with rigor.
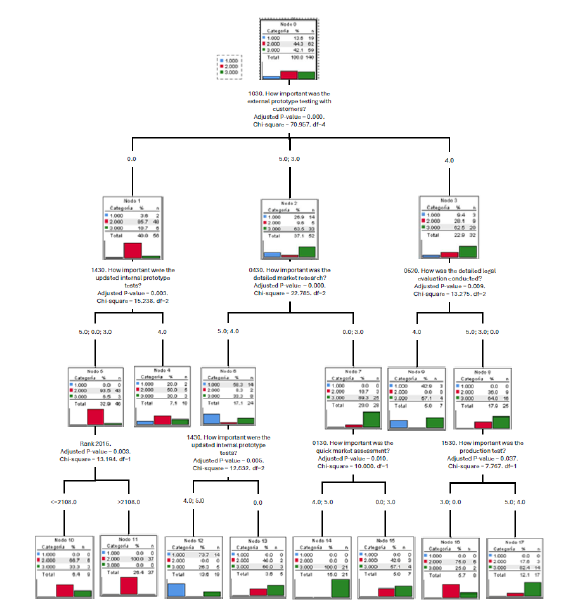
Table 4 Characterization and classification of clusters
Two clusters had the highest level of quality, with two different orientations: cluster 1 was market-oriented and cluster 3 was technically oriented. By contrast, cluster 2 lacked sufficient quality in its NPDP, evidenced by the low number of activities and the lack of rigor in their execution, and its orientation could not be clearly defined as either market or technically oriented.
It is important to highlight that, in the characterization, the initial market evaluation activity is not a differentiating factor between the clusters when determining MO in the NPDP. Two differentiating activities were market testing and promoted launch, but they were not significant enough for classification, as the most important variables absorbed the significance of these two market activities.
4.3. Relationship between cluster and success
To verify H1, the chi-square test was used to compare cluster membership against the self-reported level of success. The results in Table 5 and Table 6 show that companies in the two clusters with a high level of quality in their processes are more successful than those that have not reached that level. This is further confirmed by a p-value of 0.044 from the chi-square test (Value 15.866, df=8), which rejects the null hypothesis. It is also important to mention that, despite greater legal rigor in a few sectors, this does not change the low importance of legal activities in the NPDP. The results in Table 5 report the different levels of self-perceived success among the companies in each cluster. Table 6 is a theoretical table showing the expected distribution of self-reported success if the cluster variable was not relevant.
Table 5 Level of success reported by companies in each cluster
| Cluster | |||
|---|---|---|---|
| Success Level | 1 | 2 | 3 |
| High QualityMarket | Low QualityNot Defined | High QualityTechnical | |
| 1 | 0 | 4 | 1 |
| 2 | 1 | 7 | 1 |
| 3 | 5 | 24 | 15 |
| 4 | 9 | 24 | 31 |
| 5 | 4 | 3 | 11 |
Table 6 The expected level of success according to the cluster if the cluster were not relevant
| Success Level | Cluster | ||
|---|---|---|---|
| 1 | 2 | 3 | |
| High QualityMarket | Low QualityNot Defined | High QualityTechnical | |
| 1 | 0.7 | 2.2 | 2.1 |
| 2 | 1.2 | 4.0 | 3.8 |
| 3 | 6.0 | 19.5 | 18.5 |
| 4 | 8.7 | 28.3 | 27.0 |
| 5 | 2.4 | 8.0 | 7.6 |
| Total | 19 | 62 | 59 |
Table 7 reveals (a) an asymmetry towards lower success values (1, 2, and 3) in cluster 2, and (b) an asymmetry towards higher success values (4 and 5) in clusters 1 and 3, with the greatest asymmetry in cluster 3. This demonstrates the difference between high-quality and low-quality clusters. However, H1 is not supported, as the greatest asymmetry between reported and expected values is observed in cluster 3, which has a technical orientation, not a market orientation (MO). This inference is based on the observation that, for higher success levels (4 and 5), the reported values were much higher than expected in cluster 3, according to the sample.
Conversely, at lower success levels (1, 2, and 3), the reported values were lower than expected in the sample. Thus, obtaining high values at success levels 4 and 5 is favourable, while high values at success levels 1 and 2 are unfavourable. Therefore, considering the variables analyzed in the sample, what differentiates companies in terms of the success of new products is the quality level of the NPDP and whether they take a market or technical approach to this process, with the high-quality technical approach being reported as the most successful. Comparing what companies reported (Table 5) against what they expected (Table 6), the level of success per cluster creates Table 7, which gives understanding of the asymmetry in the responses within each cluster.
Table 7 Difference of reported minus expected values in success by cluster
| Success Level | Cluster | ||
|---|---|---|---|
| 1 | 2 | 3 | |
| High Quality Market | Low Quality Not Defined | High QualityTechnical | |
| 1 | -0.7 | 1.8 | -1.1 |
| 2 | -0.2 | 3.0 | -2.8 |
| 3 | -1.0 | 4.5 | -3.5 |
| 4 | 0.3 | -4.3 | 4.0 |
| 5 | 1.6 | -5.0 | 3.4 |
| Total | 0.0 | 0.0 | 0.0 |
Lastly, the comparison between cluster membership and the manufacturing sector was made using the chi-square test. The results do not differ from those expected, as demonstrated by a p-value of 0.907 from the chi-square test (Value = 15.442, DF = 24). Thus, it can be seen that the sector does not influence the quality or orientation of new product launches.
Concluding
5. Discussions, Conclusions, Limitations and Future Research
5.1. Discussions
The study of the success factors of the NPDP is crucial for firms, as the new product failure rate stands at around 25-40%. (Castellion & Markham, 2013; Evanschitzky et al., 2012). Empirical evidence highlights that a structured NPDP is a critical determinant of new product success (Cooper, 2019; Salerno et al., 2015). The use of a formal development process with clearly defined stages and gates increases NPDP effectiveness (Mabert et al., 1992). While adopting this structure is essential, on its own it does not guarantee the success of a new product. In this process, each activity must be carried out with rigor. Therefore, there is a strong correlation between the success of new products and the proficiency with which activities are executed at every stage of the process (Cooper & Kleinschmidt, 1986).
In addition, these activities are mainly oriented towards the acceptance of the product in the market or the technical capacity of the company to manufacture it. The literature often proposes that the greater the market orientation in the NPDP, the greater the new product success (e.g., Kohli & Jaworski, 1990; Ledwith & O'Dwyer, 2009; Najafi-Tavani et al., 2016; Narver et al., 2004; Reid & Brady, 2012; Tyler & Gnyawali, 2002; Zhang & Duan, 2010). Despite this evidence, some authors, like Noble et al. (2002), are skeptical about establishing a relationship between market orientation and the success of new products. Even so, some studies found that technically-oriented activities tend to be carried out more proficiently than those oriented to the market (Cooper, 2019). In fact, technical capabilities have a significant influence on the new product development performance and product competitiveness (Liu & Jiang, 2016).
Our findings reveal that in Peruvian manufacturing companies, market orientation is not perceived as a critical factor for new product success, perhaps because prices are the dominant purchasing criterion in the markets in which they participate. In addition, innovation in manufacturing companies occurs mainly through adopting new technologies or improving processes (Seclen-Luna et al., 2023); that is, companies are focused on expanding their technological capabilities. In addition, since market-oriented activities are generally more expensive than technically-oriented ones, it is possible that the latter had adequate funding and therefore were carried out more rigorously. If this were the case, market activities may have been conducted less rigorously by companies due to the relative scarcity of financial resources.
5.2. Conclusions
Understanding the interplay between NPDPs and their activities orientation demands a conceptual framework that could be applied in the context of developing economies. The present research examines these relationships in Peruvian manufacturing companies to corroborate theories that apply to developed economies (Cooper, 2019), which face more complex production systems and markets than in developing economies such as Peru. Customers in developed economies tend to respond more critically to market stimuli, so companies must make greater efforts to consider customer opinions during the NPDP (Reid & Brady, 2012). Future research could focus on developing a measurement model tailored to developing economies.
From a theoretical perspective, this study contributes to the ongoing debate regarding the relative importance of market orientation versus technical orientation in the context of new product development processes (NPDP). On the one hand, several studies suggest that market orientation, when rigorously applied within the NPDP framework, plays a pivotal role in achieving new product success (e.g., Ledwith & O'Dwyer, 2009; Narver et al., 2004; Tyler & Gnyawali, 2002; Zhang & Duan, 2010). Conversely, other research argues that organizations adopting a technically oriented approach to NPDP, characterized by the rigorous execution of activities, tend to exhibit superior performance compared to their market-oriented counterparts (e.g., Cooper, 2019; Liu & Jiang, 2016).
The findings indicate that companies engaging in rigorously executed NPDP activities with a technical orientation achieve greater success compared to those that implement NPDP activities with limited rigor and a market-oriented approach.
Although Peruvian companies report engaging in NPDP activities, it is likely that these activities are either not well-structured or inadequately executed. Consequently, findings provide valuable guidance for optimizing the allocation of resources to specific activities within the local context (Seclen-Luna et al., 2024a). It is essential to acknowledge that the absence of certain activities in the classification algorithm does not imply their lack of importance, as they may function as hygiene factors. In this regard, while all activities within the process warrant attention, greater priority should be assigned to the critical activities identified in this study.
5.3. Limitations and future research
One of the limitations of this study is that the low number of observations restricts the analysis at an industrial level; thus, interpretations are only at the manufacturing industry level as a whole and not by specific branches.
Second, the success variable was measured based on the self-perception of the respondents, which means the scale definition may differ between market-oriented and technically-oriented respondents. This difference relates to the expectation of success versus the perception of success. In this case, market-oriented companies may have higher expectations of success, making it necessary to measure, control, and account for this phenomenon in future research. Companies with higher expectations of success may perceive lower self-reported success than those with lower expectations, even if actual results are similar. This idea corresponds with and is supported by the study by Parasuraman et al. (1988), which proposes that satisfaction results from contrasting expectations with perceptions. Given that self-perception of success is defined as satisfaction with achieved outcomes, future studies should explore this topic further and establish an objective metric for success to facilitate more accurate comparisons across various types of companies and regions.
As for recommendations for future research, first, the findings may imply that Peruvian companies prioritizing the technical dimensions of the NPDP tend to employ individuals with more advanced professional qualifications, thereby facilitating more stringent process management and potentially enhancing its success. It is worth highlighting that, in Latin American countries, education in marketing and business management has traditionally lacked the rigor typically found in more developed economies, where much of the existing research has been conducted (Seclen-Luna et al., 2024b). This contrast should be carefully examined and incorporated into future research efforts.
Secondly, future research should focus on documenting the contributions of studies such as this one, with the aim of developing a comprehensive model to assess the influence of NPDP variables on the success of new products in underdeveloped countries and medium-sized enterprises. Current literature has played a crucial role in advancing new product development processes; however, it is now essential to expand the scope of research to address more specific contexts, such as resource-constrained economies and smaller enterprises.
Lastly, this study is cross-sectional in nature and therefore does not capture the dynamics of the NPDP, where there are more complementary variables. Therefore, it is suggested that future longitudinal studies be carried out to establish these relationships.
References