Article
DOI:
https://doi.org/10.18845/te.v18i2.7142
Brand equity and purchase decision of fast-moving consumer goods
Capital de marca y decisión de compra de productos de consumo de alta rotación
TEC Empresarial, Vol. 18, n°. 2, (Mayo - Agosto, 2024), Pag. 97 - 114, ISSN: 1659-3359
How cite: Macias, W., Barquet-Arenas, G., & Yambay-Aucancela, J. (2024). Brand equity and purchase decision of fast-moving consumer goods. , 18(2), 97–114. https://doi.org/10.18845/te.v18i2.7142
AUTHORS
Washington Macias*

Facultad de Ciencias Sociales y Humanísticas; Escuela Superior Politécnica del Litoral, ESPOL; Guayaquil, Ecuador.
wamacias@espol.edu.ec.
![]()
Gabriela Barquet-Arenas
Facultad de Ciencias Sociales y Humanísticas; Escuela Superior Politécnica del Litoral, ESPOL; Guayaquil, Ecuador.
gbarquet@espol.edu.ec.
![]()
Jazmín Yambay-Aucancela
Facultad de Ciencias Sociales y Humanísticas; Escuela Superior Politécnica del Litoral, ESPOL; Guayaquil, Ecuador.
jajayamb@espol.edu.ec.
![]()
Corresponding Author: Washington Macias
ABSTRACT
Abstract
This work analyses the influence of consumer-based brand equity on the purchase decision of fast-moving consumer goods in Ecuador. By estimating a partial least squares structural equation model and a logit model on a sample of 120 Ecuadorian university students, it was found that brand awareness with a strength of association is positively related to perceived quality, perceived quality influences attitudinal loyalty, and loyalty influences overall brand equity. In addition, after controlling for reference prices, overall brand equity has a direct positive effect on consumers' purchase decisions. For brand managers, the main implication of these findings is that investments to improve the dimensions of brand equity, with an emphasis on loyalty, is a relevant mechanism to increase sales and generate greater brand value.
Keywords: Consumer-based brand equity; purchase decision; fast-moving consumer goods.
Resumen
Este trabajo analiza la influencia del capital de marca desde la perspectiva del consumidor en la decisión de compra de productos de consumo de alta rotación, en Ecuador. Estimando un modelo de ecuaciones estructurales por mínimos cuadrados parciales y un modelo de regresión logística, con una muestra de 120 estudiantes universitarios ecuatorianos, se encontró que la notoriedad de la marca y fuerza de las asociaciones se relaciona positivamente con la calidad percibida, la calidad percibida influye en la lealtad actitudinal, y la lealtad influye en el capital de marca global. Además, una vez que se controla por precios referenciales, se demuestra que el capital de marca tiene un efecto positivo en la decisión de compra de los consumidores. La principal implicación para los administradores de marcas es que los esfuerzos e inversiones hacia acciones que mejoren las dimensiones del capital de marca, con énfasis en la lealtad, es un mecanismo relevante para incrementar las ventas y generar mayor valor financiero de la marca.
Palabras clave: Capital de marca; decisión de compra; productos de consumo de alta rotación.
Introduction
1. Introduction
Properly managing a brand has become a priority within organizations due to its ability to provide financial benefits (Christodoulides & de Chernatony, 2010). As evidence of that, a recent study using data from Interbrand’s brand value rank shows that brand value has a positive and significant effect on firm profitability (Kumar et al., 2021). According to this rank, Apple is the most valuable brand in the world, reaching US$ 482.22 billion (Interbrand, 2022), representing approximately 18% of its market capitalization (as October 2023). The main brand from the fast-moving consumer goods (FMCG) industry is Coca-Cola, with a brand value of US$ 57.54 billion (24% of mkt. cap.). Effective branding generates competitive advantages that translate into sustained growth for the company. The concept behind this competitive advantage is consumer-based brand equity (CBBE), understood as the added value perceived by the consumer in a branded product, compared to the same product, but without brand (Aaker, 1991; Keller, 1993; Davcik et al., 2015).
Several authors recognize brand equity as a multidimensional construct (Aaker, 1991; Keller, 1993; Christodoulides & de Chernatony, 2010; Buil et al., 2013) that is formed from brand salience in the consumer's mind (awareness), brand associations, perceived quality of its products, and loyalty (Aaker, 1991). Keller (1993), on the other hand, argues that brand awareness and brand image, which is made up of different types of associations, are the dimensions that contribute to the formation of brand equity. The conceptualization proposed by Aaker is the most widely used by various authors in this field of literature (Buil et al., 2013; Macías and Cerviño, 2019; Tasci, 2021), and is the one used in the present study.
Brand equity triggers consumer behaviors that translate into higher financial brand value. This financial value is also interpreted as brand equity from the firm's perspective, or financial perspective (Rojas-Lamorena et al., 2022). Park et al. (2010) define brand equity from the financial perspective as the incremental revenues or profits attributable to branded products, relative to unbranded products.
One of the consumer behaviors triggered by brand equity is the choice of branded products when faced with a purchase situation (Keller & Lehmann, 2006; Macias & Cerviño, 2019). Previous studies analyze the effect of CBBE on purchase intentions (Buil et al., 2013; Cobb-Walgren et al., 1995; Chang & Liu, 2009; Jalilvand et al., 2011; Tharmi & Senthilnathan, 2012; Washburn & Plank, 2002), but there is little evidence of the influence on the actual purchase decision (Yulianto et al., 2022). Although intention correlates with actual behavior, these variables do not always coincide (Ajzen, 1985), so it is useful to investigate the purchase behavior of consumers when faced with alternative brands, in order to measure the real effect of marketing efforts.
The present research aims to analyze the influence of brand equity, as conceptualized by Aaker, on the purchase decision of Ecuadorian FMCG consumers. FMCG is the largest group of consumer products, including packaged food and beverages, personal health and home care products, which are frequently purchased by households and therefore have a fast turnover. The global FMCG market size was estimated at US$11,491 billion in 2021 and is projected to reach US$18,939 billion by 2031 (Allied Market Research, 2023). In Latin America, the FMCG sector is showing signs of recovery after the COVID-19 pandemic, with consumers from some countries more resilient in terms of purchasing (Brazil, Mexico) and consumers from other countries replacing their branded products with private label (Ecuador, Bolivia) (Botana, 2023a; 2023b). Kantar publishes that the main fast-moving brands most purchased in Ecuador belong to the food, beverages and personal care categories (De la Torre, 2022).
The present study fills a gap in the branding literature for the FMCG sector, as there is a lack of studies that relate mindset variables, such as CBBE, to behavioral outcomes, such as actual purchase. It also provides evidence for a Latin American country; an underrepresented region in the FMCG literature. The results of this research can help brand managers and decision makers to improve branding activities by identifying the dimensions that most influence the construction of brand equity in FMCG and improving them in order to create strong brands that can be sustainable over time, allow charging better prices (price premium), can be used as a platform to launch new products (brand extensions), and can become resilient brands in times of crisis (Farquhar, 1989; Keller & Lehmann, 2006), among other benefits.
The next section presents the literature review relevant to the study, as well as the development of the research hypotheses. The third section presents the methodology. The fourth section details the results of the research, and, in the last section, the conclusions are presented.
2. Theoretical framework
2.1 Brands and brand equity
Brand is defined as "a name, a term, a sign, a symbol, a design or a combination of all these elements, which identifies the manufacturer or seller of a product or service and differentiates it from the competition" (Kotler & Armstrong, 2008). From the consumer's point of view, Aaker (1991) defines brand equity as "a set of assets and liabilities, linked to the brand, its name and symbol, which add to or subtract from the value provided by a product or service to the firm or to that firm's customers". Brand equity can be evidenced in the increase in the intensity of the attitudes that consumers have towards a product with the brand name (Farquhar, 1989), being the attitude that connection established in the consumer's mind between an object and its evaluative judgment. Keller (1993) starts from the same definition of brand equity as Aaker and Farquhar, referring to brand equity as the differential effect that brand knowledge has on consumer response to marketing activities.
2.2 Dimensions of brand equity
According to Aaker (1991) , brand awareness, brand associations, perceived quality and brand loyalty are dimensions that support brand equity.
Awareness is the ability of a current or potential consumer to recall or recognize that a brand belongs to a certain product category (Aaker, 1991; Christodoulides et al., 2015). According to Aaker (1991), awareness has several hierarchical levels, from the highest to the lowest: being the brand most remembered or remembered first (top of mind), being remembered spontaneously but not first, being recognized in an assisted way, being unknown.
Brand associations are the connections that exist in the mind of a consumer in relation to the product or service offered by a given brand. These connections can be attributes of the product or service, emotions or experiences that the consumer has had when interacting with the brand (Keller & Brexendorf, 2019), which can be remembered during the consumer's purchase decision process, or when searching for those attributes, emotions or experiences. Associations can vary on a continuum from negative to positive; when positive, they can increase consumer credibility and trust in the brand. In addition, associations can vary in strength; the stronger they are, the more easily they are remembered. Finally, the more unique the associations, the easier it is to differentiate a brand from its competitors (Keller & Brexendorf, 2019). Aaker (1996) expanded its original conceptualization including different types of associations, such as brand personality and organizational associations.
Perceived quality is the subjective evaluation made by consumers about the superiority or inferiority of the brand with respect to other competitors in the market (Sürücü et al., 2019). Perceived quality depends mainly on the strength and content of associations about the brand's product attributes and performance (Aaker, 1991; Zeithaml, 1988), although it could also be influenced by aspects such as brand name, price, advertising (Sürücü et al., 2019) or even packaging, as demonstrated in food brands (Magnier et al., 2016).
Loyalty refers to the level of fidelity that customers have towards a brand or their intention to select it as their first choice (Aaker, 1991; Yoo & Donthu, 2001), which depends on whether they have had a direct and satisfactory experience with that brand's products or services. If the experience has been positive and has exceeded the consumer's expectations, it generates a preference for that brand in future purchases, fosters a positive attitude towards the brand and increases the predisposition to repurchase it. Aaker (1991) argues that loyalty is an important factor in building brand equity and, in turn, brand equity helps to consolidate long-term loyalty, because the greater the brand equity, the less time is needed to search for information in future purchases.
On the other hand, Keller argues that brand awareness and brand image are the dimensions that makeup brand equity, where the image is made up of the different types of brand associations, such as product or service attributes, sensations, experiences and attitudes (Keller & Brexendorf, 2019). It is acknowledged that there is no consensus on the conceptualization of brand equity (Rojas-Lamorena et al., 2022). In this study, we prefer to use Aaker's conceptualization because, in our opinion, it provides a more elaborate breakdown of the brand equity construct and better explains the potential relationships among its different dimensions. The literature review by Tasci (2021) showed that most studies reflect Aaker's framework. Moreover, the findings of Christodoulides et al. (2015) suggest that Aaker's conceptualization of CBBE is more stable for goods brands than for service or internet brands, suggesting its suitability for FMCG.
2.3 Brand equity literature in FMCG
Several studies are focusing on brand equity constructs and the FMCG market in various countries. In Algeria, Menidjel et al. (2017) used a sample of soft drink and fruit juice consumers and found that brand loyalty is influenced by satisfaction, mediated by brand trust, in both product categories. Morkūnas and Grišmanauskaite (2023) studied the drivers of loyalty in the FMCG sector (beers) in Lithuania. According to their findings, customer loyalty is driven by purchase frequency, promotion, price, and perceived quality through mediating variables such as brand trust and brand satisfaction. Fortes et al. (2019) analyzed the determinants of loyalty for a soft drink brand in Brazil and found that brand awareness positively influenced perceived quality but did not establish a hypothetical effect of perceived quality over loyalty, as Aaker’s framework suggests.
Using a sample of cosmetics and chocolate brands in Germany, Nierobisch et al. (2017) demonstrated that flagship stores (e.g., M&M or Coca-Cola stores in Orlando, FL) are useful for enhancing brand experience. However, the effect of enhanced brand experience on consumer responses was mediated by both brand equity and brand attachment, demonstrating the importance of creating brand equity. Anselmsson and Bondesson (2015) studied the customer mindset metrics to actual market performance of Swedish FMCG brands, and concluded that attitudinal loyalty is one of the strongest predictors of actual behavior. The authors call for additional studies that bridge the gap between mindset metrics, such as attitudinal loyalty or customer intentions, and actual behavior (e.g., purchase decision) or market performance.
There is much less literature on FMCG purchase behavior. The study by Siriguppi (2022) underscores the relevance of marketing variables, including price, brand, packaging, product labeling and promotion, on the consumers' purchase decision. However, there is no multivariate analysis to test the significance of these variables on purchase intention or behavior. Dey and Sharma (2019) examined the factors involved in decision making while purchasing FMCG in India. The authors asked the respondents to rank the factors but did not estimate a model to test the significance of such variables. The only perceptual variable analyzed is social pressure. This review shows a lack of studies that relate mindset variables, such as CBBE, to actual behavior. In addition, Latin American markets are underrepresented in the recent literature on FMCG (Fortes et al., 2019).
2.4 Brand equity dimensions and purchase decision: hypotheses development
According to Kotler and Keller (2012) , the process a consumer goes through to make a purchase decision consists of five stages: need recognition, information search, evaluation of alternatives, purchase decision and post-purchase behavior. However, the consumer's awareness of each of these stages will depend on the type of purchase being made, which means that he or she will not always be involved with all stages to the same extent. This paper does not study the purchase process as such, but rather how the dimensions of brand equity can affect the stages of the process, with a final effect on the purchase decision.
Brand awareness functions as the anchor for the creation and strengthening of associations in the consumer's mind. Brand awareness represents a node in the consumer's mind so that different associations can be added to the brand and an information file can be created. It has been proved that exposition to advertising, rather than experience, contributes to build brand awareness in FMCG (Baumann et al., 2015). According to Aaker (1991) , if a brand has high awareness, it is more likely that the set of associations related to perceived quality has been integrated into the consumer's cognitive structure. Moreover, high awareness may be a sign that the brand has been successfully present in the market for a long time, which in turn may be interpreted as a sign of a better-quality product (Aaker, 1991). Fortes et al. (2019) demonstrate the positive relationship between awareness and perceived quality in FMCG in the Brazilian beer market. On the other hand, the importance of associations is their effectiveness in making purchasing decisions. Stronger associations are more easily and quickly remembered when evaluating the quality of the brand's products. Empirically, Yoo and Donthu (2001) and Yoo et al. (2000) show that the dimensions of awareness and strength of associations operate jointly on brand equity. Based on these arguments, the following hypothesis is put forward:
The positive evaluation of a product's quality can generate favorable attitudes towards the brand and, therefore, foster loyalty. When consumers are in the process of making a purchase decision, their attitudinal loyalty leads them to consider the brand and deliberately reject information about other brands (Saavedra-Torres, 2004). The more positive associations a brand has, including perceived quality, the greater the likelihood that consumers will develop a predisposition towards it and choose it as their preferred option (Keller & Lehmann, 2006). On the other hand, consumers' perception of brand quality can improve the results of marketing strategies. Consumers who perceive higher product quality of a well-known brand are more likely to respond favorably to promotional campaigns and feel motivated to buy that brand (Aaker, 1991). In the FMCG market, perceived quality has been found to contribute to loyalty building by improving satisfaction and trust in the brand's products (Morkūnas & Grišmanauskaite, 2023). With this background, it is proposed that:
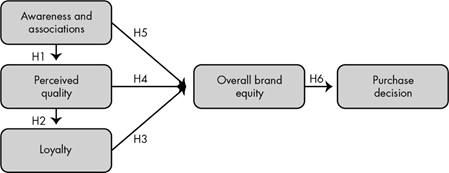
The global construct, named overall brand equity by Yoo et al. (2000) , is theoretically related to awareness and associations, perceived quality and loyalty. Awareness is important because the greater it is, the greater the probability that the consumer will consider the brand among his or her set of possible options for the purchase decision and bypass the alternatives evaluation stage (Aaker, 1991). There is even evidence that awareness may be more important in purchase decisions of low-involvement product categories, where the relevance of the product is lower for the consumer and the purchase process is done with less effort (Macias et al., 2021). Favorable, unique and strong associations, in addition to high perceived quality, generate brand differentiation from competitors in the consumer's mind, contributing to the perception of added value (Buil et al., 2013). High levels of loyalty reflect a commitment to choose the brand as the first option and low probability of brand switching (Aaker, 1991). In a previous study in the FMCG sector, Atilgan et al. (2005) showed that attitudinal loyalty has a positive relationship with overall brand equity. These aforementioned effects allow us to propose the following three hypotheses:
H3: Brand loyalty is positively related to overall brand equity.
H4: Perceived quality is positively related to overall brand equity.
H5: Awareness and strength of associations are positively related to overall brand equity.
Brands with high overall brand equity generate consumer preference for their products during a purchase decision. Researchers have found positive effects of brand equity towards purchase intention and actual purchase, i.e. individuals with high perceived brand equity are more likely to purchase the brand (Buil et al., 2013; Cobb-Walgren et al., 1995; Jalilvand et al., 2011; Tharmi & Senthilnathan, 2012; Washburn & Plank, 2002).
Although there is a positive correlation between brand equity and purchase intention, it is important to keep in mind that the consumer has yet to make the final purchase decision. According to the theory of planned behavior, (Ajzen, 1985; 1987), purchase intention is a factor prior to purchase behavior, but the final purchase decision depends on other non-motivational factors, such as resource availability (money, time) and purchase opportunity (access to points of sale, availability of the product at the point of sale). Therefore, although brand equity may positively influence purchase intention, it does not necessarily guarantee purchase behavior. Along these lines, Yulianto et al. (2022) show empirical evidence that brand equity has an effect on the purchase of Halal (accepted as healthy by the Muslim religion) cosmetic products in Indonesia. Therefore, we can predict a positive relationship between brand equity and purchase decision:
H6: Overall brand equity positively influences the purchase decision.
It is recognized that price evaluation is an important task in the buyer's decision. The price can influence the brand chosen, the point of sale chosen, the right moment and the volume of the purchase. The consumer tends to compare the price of the product with others and then decide whether it is well positioned or not. This is known as the reference price (Niedrich et al., 2001). In the present research, the reference price was used as a control variable because although it affects the purchase decision, it is not within the objectives of the research. Figure 1 shows the conceptual model of the study.
Methods
3. Methodology
3.1 Sample
The target population defined in this study is university students (men and women). The sample was taken at a large university in the city of Guayaquil (Ecuador). It was decided to use a sample of students because of the ease of access and the homogeneity of the sample. According to Calder et al. (1981) , student groups reflect greater homogeneity than the general public. This helps to reflect the similarities in a group of consumers of a particular brand as opposed to the general public. In addition, Calder et al. justify experiments with samples of university students in research that seeks to contrast theories. The homogeneity of this type of sample reduces error variance and allows for stronger theory-testing (Dwivedi & McDonald, 2018).
3.2 Preliminary procedures
Through the application of two focus groups, one for men and the other for women (n between 8 and 10 students), eight categories of products commonly used by the target population were identified (bath soap, shampoo, deodorant, toothpaste, dental floss, notebook, pen and soft drinks), as well as the potentially most used brands.
Then, a preliminary test was carried out on samples of between 44 and 59 students with the objective of identifying the four most important product categories and confirming the most used brands of such categories, which had been preselected in the focus groups (table 1).
Table 1: Product categories and brands chosen for the final study.
| # | Product categories | Most used brands |
|---|---|---|
| 1 | Toothpaste | Colgate |
| 2 | Deodorant | Rexona |
| 3 | Soft drink | Coca-Cola |
| 4 | Pen | BIC |
3.3 Survey and measurement of variables
A survey was designed with a final sample size of 120 students (56.67% female, 43.33% male; average age = 21.23, Std. Dev. = 2.90), divided into four groups corresponding to each of the four brands used as target brands, as explained below. A questionnaire was developed for each selected brand. However, all questionnaires maintained the same format and order of questions. The instrument was administered electronically using the online tool Jotform. In the first part of the questionnaire, four demographic questions were asked. Then the online purchasing section was introduced, where a real purchasing budget of $5 USD per student was assigned. In this section, respondents had to purchase a combination of products that included the default category in the study design. The purchased products were physically delivered the same week they were ordered online. If any money was left over after purchasing the requested products, they were given that money in cash. This minimized the risk that students would order more expensive products to spend their allotted budget completely. During the purchase process, a variety of brands (options) were offered for each product category, in order not to reveal the purpose of the study and the target brands. The purchase decision variable was measured with a dichotomous variable that took the value of 1 if the target brand of the group to which the respondent belongs was selected during the purchase.
In the next section of the questionnaire, statements were included to measure the several dimensions of brand equity, according to the study by Yoo et al. (2000) , whose scales are widely used in CBBE research (Rojas-Lamorena, 2022). These statements were evaluated on a 7-point Likert scale, with 1=“Strongly disagree” and 7=“Strongly agree”. The statements were distributed as follows: eight for brand awareness and strength of associations, six for perceived quality, three for loyalty (conceptualized as attitudinal, not behavioral), and four for overall brand equity (table 2). These statements were translated from English to Spanish by bilingual professionals from a foreign language center and then validated by a Marketing professor to confirm conceptual equivalence, as suggested by Douglas and Craig (2007) . Finally, the statements were translated back into English, showing a high level of coincidence with the original version.
The placement of the brand equity section after the purchase activity was done strategically to avoid the bias of respondents reading the name of the target brand before making the purchase decision. Likewise, it avoids inducing a processing or analysis of attributes such as perceived quality, or triggering associations or attitudes, due to reading these questions prior to the purchase decision.
The distribution of respondents according to the target brands was as follows: Colgate (29 students), Rexona (30 students), Coca Cola (31 students) and BIC (30 students).
3.4 Measurement model assessment
The evaluation of the measurement model was carried out using the following criteria: reliability with Cronbach's alpha and composite reliability (CR) indicators, convergent validity with average variance extracted (AVE), and discriminant validity with Heterotrait-Monotrait ratio of correlations (HTMT). HTMT ratio has shown better performance than the Fornell-Larcker criterion for discriminant validity (Henseler et al., 2015). We also tested whether the measurement model had significant common-method bias (CMB).
3.5 Conceptual model testing
To test the component of the proposed theoretical model which relates the dimensions of brand equity to the overall construct (Figure 1), a structural equation model was estimated by partial least squares (PLS), using the SmartPLS 4 software (Ringle et al., 2022). PLS estimation is not subject to as many restrictive assumptions as covariance-based structural equation estimation and is preferable for small samples and complex models with many latent variables and indicators (Hair et al., 2019).
To test hypothesis 6, the Logit or Logistic Regression model was applied, where the overall brand equity is the explanatory variable and the purchase decision, the dependent variable. The use of this type of regression model is justified when the dependent variable is a dichotomous response, as in this case: to buy or not to buy the brand. Within the Logit model, the reference price was considered as a control variable because the products of the target brands and distracting brands have different prices. Specifically, an indicator was built according to Helson's Price Adaptation Level Theory, which suggests that consumer judgments towards prices are proportional to deviations from the comparative mean (Niedrich et al., 2001). Let PR be the subjective valuation of the price of a product, calculated as PR = pf - (ph+pl)/2, where pf is the price of the focal brand or target brand, ph is the highest price of the competitors, and pl is the lowest price of the competitors (Niedrich et al., 2001). Table 2 shows the constructs scales, factor loadings, reliability, and convergent validity.
Table 2: Constructs scales, factor loadings, reliability, and convergent validity.
| Items by construct | Loadings | Cronbach's α | CR | AVE | |
|---|---|---|---|---|---|
| Awareness and strength of brand associations (AS) (Yoo et al., 2000)* | 0.819 | 0.819 | 0.477 | ||
| as1 | I know what (brand) looks like. | 0.744 | |||
| as2 | I can recognize (brand) among other competing brands. | 0.583 | |||
| as3 | I know (brand). | ** | |||
| as4 | I am aware of (brand). | 0.665 | |||
| as5 | Some characteristics of (brand) come to my mind immediately. | 0.728 | |||
| as6 | I can immediately recall the symbol or logo of (brand). | ** | |||
| as7 | I have difficulty in imagining (brand) in my mind. | ** | |||
| as8 | When I think of (product category), (brand) is one of the brands that comes to my mind. | 0.721 | |||
| Perceived quality (PQ) (Yoo et al., 2000)* | 0.937 | 0.936 | 0.746 | ||
| pq1 | (brand) is of high quality. | 0.858 | |||
| pq2 | The likely quality of (brand) is extremely high. | 0.816 | |||
| pq3 | The probability that (brand) fulfills its function is very high. | 0.899 | |||
| pq4 | The likelihood that (brand) is reliable is very high. | 0.885 | |||
| pq5 | (brand) must be of very good quality. | 0.858 | |||
| pq6 | (brand) appears to be of very poor quality. | ** | |||
| Loyalty (LO) (Yoo et al., 2000)* | 0.904 | 0.907 | 0.768 | ||
| lo1 | I consider myself to be loyal to (brand). | 0.927 | |||
| lo2 | (brand) would be my first choice. | 0.964 | |||
| lo3 | I will not buy other brands if (brand) is available at the store. | 0.719 | |||
| Overall brand equity (OBE) (Yoo et al., 2000) | 0.823 | 0.825 | 0.546 | ||
| obe1 | It makes sense to buy (brand) instead of any other brand, even if they are the same. | 0.769 | |||
| obe2 | Even if another brand has the same characteristics as (brand), I would prefer to buy (brand). | 0.834 | |||
| obe3 | If there is another brand as good as (brand), I would prefer to buy (brand). | 0.761 | |||
| obe4 | If another brand is not different from (brand) in any way, it is smarter to purchase (brand). | 0.563 |
Results
4. Results
4.1 Measurement model
Table 2 summarizes the indicators of reliability and convergent validity. In the process of adjusting the measurement model, it was necessary to drop some items to improve the reliability and convergent validity of the constructs. Ultimately, all constructs showed levels of reliability greater than the suggested threshold of 0.7 (Hair et al., 2010). However, although awareness and associations together met the reliability criteria, convergent validity through AVE was just below the recommended threshold of 0.5 (Hair et al., 2010). Malhotra and Dash (2011) argue that since AVE is a more conservative and rigorous measure than CR, when the researcher is in a situation where he must weigh both criteria, if reliability is met, he can conclude that convergent validity is adequate even though more than 50% of the variance of the construct is due to error. The remaining constructs had AVE values greater than 0.5. In terms of discriminant validity, the HTMT ratio between the different constructs should be less than 0.9 or, more strictly, 0.85 (Henseler et al., 2015). As shown in Table 3, this requirement was met in all cases. Finally, using the multicollinearity approach proposed by Kock (2015) , we checked whether there was a worrisome level of CMB through the variance inflation factor (VIF), which should be less than or equal to 3.3 for all constructs. The results of the analysis showed VIF values between 1.24 and 2.91, reflecting the absence of the CMB problem. Thus, we concluded that the measurement model is adequate.
Table 3: HTMT ratio of correlations
| HTMT ratio of correlations | PQ | LO | AS | OBE |
|---|---|---|---|---|
| PQ | ||||
| LO | 0.811 | |||
| AS | 0.849 | 0.776 | ||
| OBE | 0.804 | 0.844 | 0.810 |
4.2 Structural model for brand equity
The results of estimating the brand equity model using the consistent PLS estimation algorithm are presented in Table 4. Awareness and strength of associations (AS) have a positive and significant influence on perceived quality (PQ) (β=0.851; p-value < 0.05), which supports H1. In turn, perceived quality has a significant impact on loyalty (LO) (β=0.813; p-value < 0.05), as predicted in H2. Loyalty has a positive and significant effect on the overall brand equity construct (β=0.49; p-value < 0.05), providing evidence in support of H3. On the other hand, the direct relationships of AS and PQ to OBE were not significant, so H4 and H5 are rejected. The effect of these two dimensions on OBE occurs through LO, as demonstrated by testing specific indirect effects (Table 5).
To evaluate the structural model, the fit indicators of explained variance, R² and adjusted R², were observed for all exogenous variables in the different sections of the model. In addition, the predictive performance indicator Q², obtained through the PLSpredict process in SmartPLS 4, was observed. The results (Table 4) show a substantial fit of the model for OBE (R² close to or greater than 0.75), as well as the presence of predictive ability (Q² greater than zero) (Hair et al., 2019).
4.3 Sample size assessment
The sample size meets the requirement of the ten times rule, which indicates that the minimum sample size should be 10 times the maximum number of arrowheads pointing at a latent variable anywhere in the path model (Hair et al., 2017). In the path model for overall brand equity, there are three exogenous variables: loyalty, perceived quality, and awareness & associations. Thus, a minimum sample size of 30 observations is required. However, Sarstedt et al. (2022) suggest relying on Kock and Hadaya (2018) inverse square root method, which offers a more accurate guideline of minimum sample size requirements, based on maximum number of arrows pointing at a construct, minimum coefficient path in the model, significance level, and statistical power. According to these criteria, for βPQU→OBE =0.152, a 5% significance level and a typical 0.8 statistical power, the sample size should be over 267 observations for expect this path to be significant with a probability of 0.8 (Kock and Hadaya, 2018). However, these authors explain that an alternative which does not involve collecting more data, is to accept a path coefficient to be nonsignificant for a given sample size. In this study, we conclude that given a sample size of 120, there is no evidence to reject that the path coefficient βPQU→OBE is zero (nonsignificant).
Table 4: Structural model estimation by PLS-SEM
Table 5: Specific indirect effects
4.4 Logit model for purchase decision
To evaluate H6, a logit model was run in Stata 18 to estimate the odds ratio for the occurrence of the purchase event against the no purchase event, specifying the model as follows: PU = f(OBE, PR), where PU takes the value 1 if the consumer buys the focal brand's product and 0 if he/she does not buy it; and PR is the previously defined reference price (the distance with respect to the average of the reference prices). For this model, OBE was used as the average of the scale items. Table 6 shows the results of the estimation. The odds ratio for OBE is >1 and significant, which indicates that a unit increase in OBE changes the ratio of probabilities by a factor of 1.6, favoring the purchase event, and supporting H6. Reference price is not significant. It is recognized that brand equity is related to willingness to pay price premiums (Davcik & Sharma, 2015), so certain difference of price in comparison with competitors’ may not be a determinant to reduce brand purchase. The overall significance of the logistic regression is confirmed with the likelihood ratio test (p<0.05), while the pseudo R2 reflects that the model explains the data better than a null model (constant only). In the Hosmer and Lemeshow test, under the null hypothesis that there is no difference between the observed values and the expected values (according to the model), a χ²(8) = 2.76 and a p-value of 0.9488 > 0.05 indicate that there is a good model fit.
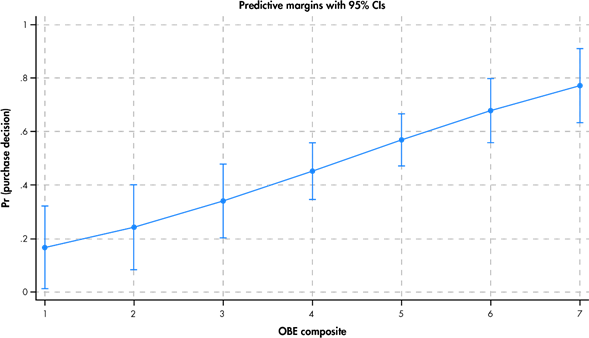
Finally, the average marginal effects of OBE over purchase decision were calculated (dy/dx) for each unit increase of OBE (Table 7). Figure 2 clearly shows the positive relationship between purchase probability and the values of OBE, based on the marginal changes previously estimated.
Table 6: Logit model results for purchase decision (PU)
Table 7: Average marginal effects
Concluding
5. Discussion and conclusions
This study, by investigating the relationship between brand equity and consumers' purchase decision, provides valuable information for the advancement of the literature in this field, as well as empirical evidence for the fast-moving consumer goods market in Ecuador.
5.1 Discussion
The results validate the composition of brand equity through the dimensions proposed by Aaker (1991) in the Ecuadorian context and demonstrate most of the proposed relationships. According to our findings, a chain of effects between the dimensions was observed in the process of brand equity formation: awareness and strength of associations positively relates to perceived quality, while perceived quality positively influences loyalty. Previously, Buil et al. (2013) and Fortes et al. (2019) found that awareness positively relates to perceived quality. However, Buil et al. (2013) found a counterintuitive negative relationship between perceived quality and loyalty.
We did not found evidence for supporting two hypotheses: the influence of awareness and associations, and perceived quality, over overall brand equity. In the study of Yoo et al. (2000) , these relationships were significant and positive. Buil et al. (2013) also failed to support the relationship between perceived quality and overall brand equity, but partially supported the relationship from associations to overall brand equity. The product categories used in these two studies were sportswear, electronics and cars. It is likely that in the case of FMCG, which imply a more frequent purchase, a direct relationship with overall brand equity would not be observed, since the consumer does not perform a high level of processing of the information contained in brand associations or regarding product quality, but instead relies mainly on those brands to which he/she is loyal or has a high level of emotional commitment, before externalizing his/her perceived added value (overall brand equity). The above does not mean that these two dimensions are not important; in fact, according to the theory and the results of this study, they are significant in building brand loyalty.
A direct and positive influence of loyalty on overall brand equity was also demonstrated. It should be noted that loyalty is the only dimension that influences the overall construct of brand equity when all dimensions appear as endogenous. From the above, it can be deducted that awareness/association and perceived quality exert their influence on overall brand capital indirectly through their effect on loyalty, as demonstrated by the analysis of specific indirect effects. Our findings align with those of Atilgan et al. (2005) in the Turkish beverage industry, where loyalty was the sole significant dimension in explaining brand equity, while awareness, associations, and perceived quality did not exhibit significance.
5.2 Conclusions, implications, and limitations
The main influence of loyalty on brand equity coincides with the results of Yoo et al. (2000) , Atilgan et al. (2005) and Buil et al. (2013) . FMCG brand managers must strive to maintain the loyalty of their customers, with a quality offering and highlighting different types of benefits in their products. Currently, private brands are emerging strongly in Latin America, with triggers such as perceived quality and price awareness, but with a mitigating factor such as perceived risk (Macías et al., 2023). Therefore, from a strategic point of view, a quality product is not enough for leading national or global brands, and they must identify what type of additional brand associations, in the form of functional or emotional benefits, are essential for their target audience, in order to differentiate themselves from generic brands. Moreover, the management of effective communication aligned with the brand image is imperative in new channels, such as social networks, as it has been proven to be related to the predecessors of loyalty: awareness, associations, and perceived quality (Sadek et al., 2018).
Additionally, FMCG brands should design loyalty programs, taking advantage of the digital environment to have direct contact with the consumer, without depending on the retailer store. The design and implementation of marketing strategies should be aimed at creating or improving brand loyalty, by means of increasing brand awareness, and reinforcing favorable associations and perceptions of product quality, with a final impact on overall brand equity.
As a final contribution, it was demonstrated that brand equity has a direct and positive impact on consumers' purchasing decisions, controlling for price effects. This finding is a noteworthy addition to the literature because previous research primarily used purchase intention as their dependent variable (Washburn & Plank, 2002; Tharmi & Senthilnathan, 2012; Buil et al., 2013). A good practice that companies should have is to regularly track their overall brand equity and its dimensions so that they can identify if there are favorable or unfavorable changes in order to maintain their sales and the financial value of their brands.
Recently, the concept of brand equity has emerged strongly in areas such as tourism (Sürücü et al., 2019), sports, or social networks (Rojas-Lamorena et al., 2022). Further studies could analyze the impact of brand equity on consumers' purchase decisions, taking into account these emerging application areas. Another research avenue could be to study complementary variables, such as corporate social responsibility (Muniz et al., 2019) or corporate reputation (Heinberg et al., 2018), as antecedents of brand equity.
Although the purpose of this study focused on the relationship of brand equity and actual purchase, controlling by price, other variables may contribute to explain better the purchase decision of FMCG. Thus, we encourage researchers to conduct studies with more comprehensive models, in online and physical settings, including complementary variables to increase the explanatory power of purchase decision, as suggested by other researchers (Dey & Sharma, 2019; Siriguppi, 2022).
An important limitation of this study is the small sample size and the fact that it solely comprised university students, necessitating caution in generalizing results to other populations. Aware of this, a technique (PLS-SEM) that performs well with small samples was chosen (Hair et al., 2019). In addition, the study was meticulously designed to ensure that the products and brands assessed were pertinent to the target audience, thereby enhancing internal validity. Despite this study being developed in a country where evidence regarding brand equity outcomes is scarce, this is also a limitation since our findings cannot be generalized to different contexts. Future research could focus on other consumer types and countries lacking empirical evidence on the topic to increase the generalizability of our findings.
Regarding the study design, we made efforts for measuring actual purchase by means of a $5 endowment for each participant. However, a limitation of this approach is that it does not fully reflect the actual conditions of a purchase decision when participants use their own money. In order to increase internal validity, participants were aware that the money they do not spend in the purchase order will be given back in cash, thus reducing the bias of ordering the most expensive products, or more units than required, to spend the entire budget.
This research enhances the understanding of the brand equity creation process from the consumer's point of view (CBBE). This better understanding makes it easier for managers to develop effective strategies, improve marketing outcomes, and optimize resources.
References