Article
DOI: 10.18845/te.v17i1.6474


Evolution of occupational illness in Spain during 2009-2020: Territorial and industrial trends


Evolución de las enfermedades profesionales en España (2009-2020): Análisis territorial y tendencias industriales


TEC Empresarial, Vol. 17, n°. 1, (January - April, 2023), Pag. 18 - 33, ISSN: 1659-3359


Article received: 02 July, 2022 - Article accepted: 03 October, 2022

AUTHORS

Dayana Delgado-Sánchez

Department of Management, Polytechnic University of Catalonia, UPC Barcelona Tech, Spain. dcds1888@gmail.com. Email


ABSTRACT

Abstract

This study analyzes the temporal evolution of occupational illnesses and their causing agents in Spain during the period 2009-2020, paying close attention to territorial and industrial trends. Similar to the case of work accidents, results suggest a positive association between the state of the economic cycle and the incidence rate of occupational illnesses. The reported increase in occupational illnesses between 2009 and 2020 should not be interpreted as bad news. Regulatory changes underwent by Spain’s government introduced a logical harmonization in illnesses’ notification criteria, which led to a temporal convergence of occupational illnesses with and without work leave days. Also, legal reforms facilitated the updating of the list of occupational illnesses and their causing agents, which constitutes a sign that the level of protection of Spanish workers improved, in terms of occupational health and safety at the workplace.

Keywords: Occupational illnesses, causing agents, economic cycle, occupational epidemiology, Spain.

Resumen

Este estudio analiza la evolución temporal de las enfermedades profesionales en España y sus agentes causantes durante el período 2009-2020, prestando especial atención a tendencias territoriales e industriales. Al igual que en el caso de los accidentes laborales, los resultados sugieren una asociación positiva entre el estado del ciclo económico y la tasa de incidencia de las enfermedades profesionales. El aumento de enfermedades profesionales reportado entre 2009 y 2020 no debe interpretarse como malas noticias. Los cambios normativos introducidos en España produjeron una lógica armonización en los criterios de notificación de enfermedades, lo que supuso una convergencia temporal en el reporte de enfermedades profesionales con y sin baja laboral. Asimismo, las reformas legales facilitaron la actualización del listado de enfermedades profesionales y sus agentes causantes, lo que constituye una señal de que mejoró el nivel de protección de los trabajadores españoles, en materia de seguridad y salud en el trabajo.

Palabras clave: Enfermedades profesionales, agentes causantes, ciclo económico, epidemiología laboral, España.


Introduction

1. Introduction


This study analyzes the evolution of occupational illnesses and their causing agents in Spain during 2009-2020, paying close attention to territorial and industrial trends.

Workplace safety is an increasingly important topic around the world with important economic and societal implications (Kivimäki et al., 2015; ILO, 2019; Lafuente & Abad, 2021). In this sense, governments and organizations are increasingly deploying resources to support respectively policies and practices that help stimulate social wealth and enhance work environments (Piore & Schrank, 2018; Lafuente & Daza, 2020; Lafuente & Abad, 2021). In this sense, perhaps because of data availability issues, underlying the design of such policies and practices is the common assumption that work accidents and illnesses can be treated and analyzed under a homogeneous framework. But, work accidents and occupational illnesses result from heterogeneous processes and entail different consequences on workers’ health (Takala et al., 2014; Toivanen et al., 2019). Besides, although progress has been made in reducing work related accidents and illnesses; work risks have not been reduced in a uniform way leaving some workers, organizations and industries overexposed to these risks (European Commission, 2021). Furthermore, the typology of work risks is changing due to a number of factors, including technological innovation, variations in the organization of production, and the restructuring of labor markets (greater flexibility, new types of contracts, the increased rate of working women, immigration waves, among others) (Kalleberg, 2012; Takala et al., 2014; Kivimäki et al., 2015).

This implies that the approach to work accidents and illnesses based on a common framework is potentially causing an under-reporting of illnesses’ effects because of the lack of specific information on prevailing industries and the potential connections between work environments and health outcomes. Also, the joint analysis of work accidents and occupational illnesses affects their monitoring by failing at disaggregating data that permits to capture the specific magnitude of their safety problems, to set policy priorities and to target interventions to enhance safety at the workplace (Leigh et al., 2001; Bofinger, 2005; Bhattacharya, 2014; Cioni & Savioli, 2016).

The structure of current data systems has many times conditioned research efforts. Most studies specifically dealing with work safety issues at national or sub-national levels have focused on either the study of work accidents or the aggregate analysis of work accidents and illnesses (Lafuente & Abad, 2021).

Because of the increased importance and visibility of occupational illnesses, as well as the value of accessing more detailed data, research addressing occupational illnesses has grown during the last decade (Trinkoff et al., 2006; Bhattacharya, 2014; Kivimäki et al., 2015; Toivanen et al., 2019; Cioni & Savioli, 2016).

Whereas the causes and consequences of occupational illnesses to workers’ health have been extensively analyzed (Trinkoff et al., 2006; Quandt et al., 2006; Bhattacharya, 2014; Kivimäki et al., 2015), comparatively few studies have examined occupational illnesses from a managerial, territorial or industrial perspective, relative to work accidents. Concretely, the main research stream on occupational illnesses mostly evaluates their prevalence in a single industry (e.g., agriculture, poultry, health care, construction, and consumer services), and has focused on, among others, musculoskeletal disorders (Quandt et al., 2006; Trinkoff et al., 2006; Bhattacharya, 2014), heart conditions (Kivimäki, 2015; Toivanen et al., 2019), and skin disorders, cuts and burns (Turjanmaa, 1987; Bofinger, 2005; Noe et al., 2007; Muula et al., 2010; Stocks et al., 2012; Zorba et al., 2013). Few studies have evaluated the incidence of occupation illnesses in multiple industries (Dembe, 2005; Zorba et al., 2013; Bhattacharya, 2014).

Overall, this research offers relevant findings that point to the social and economic value of job safety. First, these studies support the notion that the relative under-reporting of occupation illnesses is caused by delayed diagnosis related to symptom appearance and the physical and mental degeneration of workers’ health condition (Zorba et al., 2013; Bhattacharya, 2014). Second, prior work found that labor intensive industries are more prone to show higher levels of occupational illnesses, including for example, primary industries such as agriculture and poultry (Quandt et al., 2006; Muula et al., 2010), construction (Stocks et al., 2012), and consumer services sectors (Zorba et al., 2013).

Third, weak safety regulations (lack of ergonomic guidelines and programs, and poor regulatory tools to classify occupational illnesses) together with a low monitoring of businesses’ work practices (long working hours, lack of internal safety controls) increase workers’ vulnerability and, subsequently, the prevalence of occupational illnesses (Dembe et al., 2005; Quandt et al., 2006; Muula et al., 2010).

Although it falls outside the scope of this study, it is worth mentioning a second research line-rooted in the fields of economics and healthcare-that deals with work safety from a policy viewpoint. Studies in this tradition mostly focus on the role of economic fluctuations and safety controls on both work accidents and illnesses (Asfaw et al., 2011; Boone et al., 2011; Fernández-Muñiz et al., 2018; Piore & Schrank, 2018; Lafuente & Daza, 2020; Lafuente & Abad, 2021).

From a societal perspective the study of occupational illnesses should be included in the agenda of scholars and social planners. Nevertheless, much work is needed in order to increase our knowledge both on the incidence of specific illnesses in different industries and on the temporal evolution of occupational illnesses in territories with different industrial and social traditions.

Occupational illnesses are at the center of this study, and the proposed analysis of the evolution of occupational illnesses in Spain from 2009 to 2020 pays close attention to differences and trends at the territorial level and at the industrial level. In particular, by describing the temporal trajectory of work-related illnesses this study attempts to document the patterns of occupational illnesses across heterogeneous territories-i.e., Spain’s Autonomous Communities-and across industries. To the best of my knowledge, this is the first study that specifically deals with the descriptive analysis of occupational illnesses in Spain. Despite its utter simplicity, the approach adopted in this paper seeks to offer novel evidence that enriches our knowledge on occupational illnesses and their potential incidence in different economic and industrial settings.

The plan of the paper follows. Section 2 describes the data and variable definition, while the findings are offered in Section 3. Finally, Section 4 presents the concluding remarks, policy implications, and future research lines.

2. Data and variable definition

2.1 Data

The data used in this study was collected from the annual reports of the General Office of Statistics on Occupational Illnesses of the Spanish Ministry of Employment and Social Security (https://w6.seg-social.es/PXWeb_NCIP/pxweb/es/Enfermedades%20profesionales/ ).

These reports contain specific data on the number of medically certified occupational illnesses suffered by workers affiliated to the social security regime. Available information includes the breakdown of occupational illnesses by territory, industry, and the causing agent of the documented work-related illnesses.

The final dataset contains information for the period 2009-2020. For the study period, the data was collected for two different groups of interests. First, the geographic group includes the 17 Autonomous Communities that form Spain (NUTS-2). Second, the economic group splits the data into five industries: 1) primary industries (i.e., agriculture, livestock farming, forestry, and fishing), 2) manufacturing, 3) construction, 4) retail (wholesaling and retail sale), and 5) services (professional and consumer oriented).

2.2 Variable definition

Before presenting the variables used in this study, it is important to offer a definition of occupational illness. Based on the Royal Decree 08/2015 (art. 157) (BOE, 2015), “an occupational illness is defined as that contracted by employees from work activities specified in the table developed and approved in this Law, and that is caused by the action of the elements or substances indicated in the said table for each type of occupational illness”.

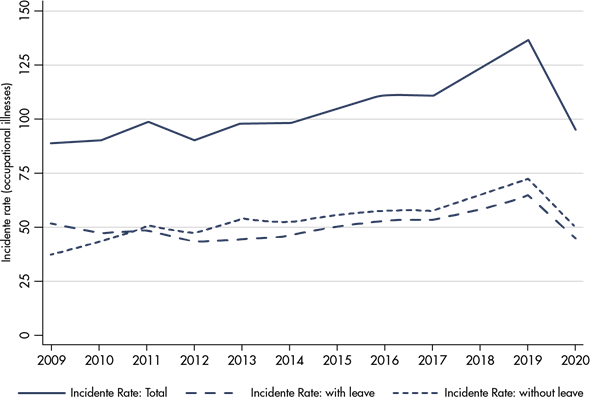
With this definition in hand, for the analysis the following variables were extracted from the databases. First, the incidence rate (IR), which is calculated as the number of occupational illnesses per one hundred thousand workers (illnesses/100,000 workers). Additionally, the IR was split into two categories: occupational illnesses with work leave and occupational illnesses without work leave. This classification is a good proxy measure of the severity level and expected duration of occupational illnesses.

Second, the study includes the average number of days away from work (AL), which is computed as the number of days of work leave of all closed occupational illness files. The time window for this variable includes the total time (in days) elapsed between the day the occupational illness is notified until the day that the file is closed either because the worker is cured or, in the worst-case scenario, because the worker dies.

Finally, based on the table of occupational illnesses legally approved and published in the Royal Decree 08/2015, the third variable takes into account six different agents causing occupational illnesses: 1) occupational illnesses caused by chemical agents (e.g., metals, metalloids, halogens, inorganic and organic acids, among others); 2) occupational illnesses caused by physical agents for example noise (equal to or greater than 80 decibels), forced postures and repetitive movements at work, sustained pressure, fatigue, among others); 3) occupational illnesses caused by biological agents (e.g., infections related to hospitalization or health care, infections or parasites transmitted to people by animals or their products and carcasses, infections caused by insects, bacteria and parasites, among others); 4) occupational illnesses caused by inhalation of substances and agents not included in other sections (e.g., dust of silica, aluminum, coal, asbestos, synthesized metals, metallic compounds, among others); 5) occupational skin illnesses caused by substances and agents not included in any of the other sections (e.g., low molecular weight substances below 1,000 daltons including metals, wood dust, pharmaceutical products, plastic chemicals, additives, solvents, preservatives, catalysts, and perfumes; and high molecular weight substances, for over 1,000 daltons, including substances of plant and animal origin, microorganisms and enzymatic substances, animal and/or microorganisms); and 6) occupational illnesses caused by carcinogenic agents (e.g., asbestos, aromatic amines, arsenic and its compounds, benzene, beryllium, bis-(chloro-methyl) ether, cadmium, vinyl chloride monomer, chromium VI, etc.).


Results

3. Results

This section presents the results. Section 3.1 shows the overall findings for Spain, while Section 3.2 deals with the territorial results, that is, by Autonomous Community. Finally, the industry analysis of occupational illnesses is presented in Section 3.3.

3.1 Overall results: Spain

This section presents the baseline results obtained for Spain during 2009-2020. Figure 1 shows the temporal evolution of the incidence rate of occupational illnesses (IR) in Spain. To ease the interpretation of the figure, notice that the sum of the IRs with and without work leave equals to the total IR of occupational illnesses.

Figure 1: Occupational illnesses in Spain: Incidence rate (illnesses / 100,000 workers).

v17n1a02image001.png

Overall, three trends are observed during the analyzed period. First, form the figure it can be observed for the 2009- 2012 period a stable behavior in the IR of occupational illnesses, except for illnesses without work leave which experienced a 26% increase during this period.

Second, for the period 2012-2019 the IR values of occupational illnesses show slight increases. Notice that this temporal trend might be associated with the evolution of working technologies in the different industries, as well as with regulatory changes that increased the list of agents causing occupational illnesses.

Finally, a drastic fall is reported in the IR values for 2020, a result that is directly associated with the Covid-19 (SARS-CoV-2) pandemic. After the state of alarm was declared nationwide by the Spanish government, companies were forced to take measures, including changes in the organization of production to promote working-from-home, and the temporary cessation of production activities with the support of the public administration. The decrease of businesses’ activity caused the marked fall in the notification of occupational illnesses (notice that in Spain illnesses the SARS-CoV-2 virus is not catalogued as an occupational illness).

At this point, an important consideration is in order. Before 2006 the reporting of occupational illnesses was processed by organizations, so many of the possible cases were not duly notified or were notified incorrectly. However, once the Royal Decree 1299/2006 came into force, the agents responsible of the communication of occupational illnesses to Spain’s Social Security Agency are the mutual insurance companies or the occupational health and safety business with which the organizations monitor and control work safety conditions.

This regulatory change caused a logical harmonization in notification criteria, which led to a temporal convergence in the number of occupational illnesses with and without work leave. A further scrutiny of the data corroborates this intuition. Specifically, Figure A1 in the Appendix shows how before 2007 occupational illnesses without work leave were rarely notified (Pearson correlation = -0.26 and p-value = 0.53).

However, the standards set by the Royal Decree 1299/2006, common to businesses operating in all Spanish territories, brought important changes and the notification of occupational illnesses with and without work leave evolved in parallel during the period 2007-2020 (Pearson correlation = 0.56 and p-value = 0.04).

Table 1 shows the IR values and mean days away from work of all occupational illnesses by causing agent, according to the six groups defined in the Royal Decree 1299/2006. Notice that the increased identification and notification of occupational illnesses reported above is accompanied by a rise in the number of days away from work (Figure A2 in the Appendix): in 2009 workers had on average 71.68 days of work leave, whereas the average number of days away from work in 2020 was 133.67.

Table 1: Occupational illnesses in Spain: Causing agents.

Group 1 Group 2 Group 3 Group 4 Group 5 Group 6
2007 3.57 (28.79) 67.95 (39.66) 1.42 (41.50) 2.53 (40.68) 5.89 (27.72) 0.07 (20.39)
2008 4.81 (46.65) 74.54 (56.62) 2.44 (70.39) 4.02 (79.47) 6.19 (39.20) 0.17 (84.77)
2009 4.07 (63.94) 70.35 (86.51) 3.47 (81.24) 4.58 (107.16) 6.03 (40.93) 0.23 (54.24)
2010 3.91 (51.45) 74.49 (78.58) 2.02 (70.93) 4.42 (101.73) 5.21 (44.10) 0.13 (56.39)
2011 3.87 (53.65) 81.52 (83.00) 2.76 (64.34) 4.74 (89.30) 5.43 (43.45) 0.41 (107.7)
2012 3.34 (63.22) 74.08 (78.87) 2.96 (72.36) 4.01 (107.86) 5.52 (49.75) 0.29 (87.81)
2013 3.00 (63.64) 80.26 (90.51) 4.80 (40.58) 4.12 (87.81) 5.53 (40.07) 0.32 (114.59)
2014 2.76 (68.64) 80.43 (88.37) 5.32 (46.34) 4.00 (97.33) 5.46 (46.34) 0.27 (132.09)
2015 3.40 (58.97) 86.30 (91.30) 5.70 (39.88) 4.29 (111.63) 5.94 (46.15) 0.13 (108.66)
2016 3.53 (53.88) 91.69 (94.31) 4.99 (61.32) 4.78 (144.22) 6.11 (58.02) 0.20 (111.03)
2017 3.42 (63.86) 91.06 (105.01) 5.16 (44.56) 4.97 (122.07) 5.92 (55.33) 0.26 (138.97)
2018 3.54 (66.84) 101.39 (126.12) 7.28 (56.88) 4.94 (151.34) 5.80 (58.77) 0.14 (202.31)
2019 4.07 (69.77) 115.92 (125.21) 4.93 (63.02) 5.39 (129.69) 5.89 (55.21) 0.47 (101.78)
2020 2.68 (98.26) 81.77 (146.39) 3.16 (62.46) 3.24 (116.30) 4.04 (92.31) 0.23 (134.37)

Note: For each group of occupational illnesses, values in parentheses are the average number of days away from work. Occupational illnesses are grouped by causing agent as follows: 1) Group 1: illnesses caused by chemical agents; 2) Group 2: illnesses caused by physical agents; 3) Group 3: illnesses caused by biological agents; 4) Group 4: illnesses caused by inhalation of substances and agents not included in other sections; 5) Group 5: skin illnesses caused by substances and agents not included in any of the other sections; and 6) Group 6: illnesses caused by carcinogenic agents. Details on the agents included in each group are presented in Section 3.2.

From the table it can be seen that the group of occupational illnesses caused by physical agents (Group 2) show the highest IR values during the study period. Physical agents are a common cause of illnesses in industries with an important representation in Spain, for example, manufacturing, construction, hospitality, and healthcare (in particular nurses). Nevertheless, results in Table 1 suggest that occupational illnesses caused by physical agents are low in severity, measured by the number of days away from work. In this sense, the most harmful illnesses for workers are those caused by the inhalation of substances and agents (Group 4) and carcinogenic agents (Group 6), whereas skin-related illnesses report the lowest average number of days away from (Table 1).

Also notice that sectors exposed to carcinogenic agents (Group 6) cause the lowest IR of occupational illnesses, a result that is consistent with the relative weight of industries where these agents are often present (e.g., metallurgical industry, plastic industry, among others).

3.2 Occupational illnesses by Autonomous Community

The main findings for the 17 Autonomous Communities that form Spain are presented in this section. Results for the incidence rate of occupational illnesses for the 17 Autonomous Communities are presented in Tables 2 and 3, whereas Table 4 shows the breakdown of the IR values by causing agent.

Results in Table 2 indicate that the Autonomous Communities with the highest IR of occupational illnesses for 2020 are Navarra (IR = 434.63 cases per 100,000 workers), followed by La Rioja (IR = 302.84 cases), Murcia (IR = 291.32 cases), and the Basque Country (IR = 258.67 cases). On contrary, Extremadura (IR = 40.11 cases), Andalusia (IR = 33.54 cases), and Madrid (IR = 27.81 cases) are the territories reporting the lowest incidence rate of occupational illnesses.

Table 2: Wilcoxon signed-rank test results: Comparison of rank values of the incidence rate of occupational illnesses in Spain’s Autonomous Communities (selected years).

2009 2015 2019 2020
2009 - -0.503 (0.615) -0.816 (0.415) -0.548 (0.584)
2015 - 0.316 (0.752) 0.217 (0.828)
2019 - 0.357 (0.721)
2020 -

At this point, notice that the negative impact of the Covid-19 pandemic on businesses’ activity might affect IR values. Thus, I compared the rank values for 2009, 2015, 2019 and 2020 in order to verify the hierarchical structure of occupational illnesses, in terms of IR values, across Spain’s territories. Summary results of the Wilcoxon signed-rank test presented in Table 2 corroborate that the ranking of IR values reported by Autonomous Communities remains unaffected during the study period (only five Autonomous Communities show minor variations in their ranking: Asturias, Canary Islands, Castile La Mancha, Galicia, and Balearic Islands).

The findings in Table 2 suggest that, despite the changes in the economic cycle and reforms, across Spanish regions the IR of occupational illnesses and associated fluctuations follow a homogeneous pattern during the study period. I discuss this result further in Section 4.3.

An interesting result emerges from the comparison of the IR values over time. By comparing the values reported for 2009 and 2019 (last pre-Covid year in the data series), it can be observed on the one hand that Catalonia is the only territory that reduced the IR of occupational illnesses (IR in 2009 = 112.15 and IR in 2019 = 96.69), which implies a 13.78% fall (=0.1378). For the rest of Autonomous Communities, Balearic Islands (= 0.33%), and Cantabria (= 4.44%) show the lowest increase in the IR of occupational illnesses. On the other hand, the greatest increases in the IR values were found for Murcia (= 649.41%), Valencia (= 394.90%), and Canary Islands (= 105.68%) (Table 3).

Table 3: Occupational illnesses by Autonomous Community: Incidence rate (IR) values.

Autonomous Community 2009 2010 2011 2012 2013 2014 2015 2016 2017 2018 2019 2020
1 Andalusia 27.71 28.31 33.80 28.30 27.77 29.94 27.88 29.81 33.52 43.65 51.56 33.54
2 Aragon 229.27 252.18 218.51 189.88 167.77 175.31 184.57 222.50 213.19 249.96 250.80 147.33
3 Asturias 121.10 131.81 137.95 81.26 104.20 92.75 115.61 117.57 118.95 134.92 169.90 108.14
4 Canary Islands 32.83 42.61 56.81 52.44 51.99 54.18 52.00 53.62 54.26 60.87 67.53 47.61
5 Cantabria 175.68 120.30 146.73 117.95 130.42 129.19 127.43 144.10 135.10 150.25 183.49 125.16
6 Castile La Mancha 43.64 46.62 44.80 49.83 57.64 60.68 67.01 65.71 72.21 72.41 74.25 58.15
7 Castile and Leon 86.21 82.16 100.65 80.93 85.39 78.28 83.17 101.55 99.19 101.53 117.64 74.34
8 Catalonia 112.15 104.89 110.98 107.83 116.38 105.97 106.90 99.29 88.71 99.32 96.69 59.60
9 Madrid 34.01 31.89 39.89 44.35 46.73 51.85 55.77 58.34 53.33 50.40 50.84 27.81
10 Valencia 51.08 70.24 60.91 54.66 88.76 122.24 145.94 155.23 164.94 208.56 252.81 190.23
11 Extremadura 45.83 45.61 56.50 49.90 49.65 39.46 47.22 55.59 51.45 56.15 61.96 40.11
12 Galicia 110.58 107.84 114.77 102.82 100.04 111.64 118.25 129.95 139.70 133.18 151.93 119.52
13 Balearic Islands 84.10 69.68 88.60 86.35 90.81 88.61 82.35 103.79 79.38 68.69 84.37 45.63
14 La Rioja 195.56 215.29 177.32 143.65 172.91 232.16 252.46 276.14 347.38 390.49 435.99 302.84
15 Navarra 505.16 536.98 619.03 501.14 583.11 519.86 583.21 565.09 500.71 543.19 631.56 434.63
16 Basque Country 291.33 284.33 316.86 312.94 324.89 288.05 299.70 312.42 336.32 350.81 348.55 258.67
17 Murcia 49.15 68.63 105.47 86.44 91.44 96.71 159.24 169.00 195.43 269.10 368.36 291.32

The reported increase in the IR values of occupational illnesses should not necessarily be interpreted as bad news. As mentioned above in Section 4.1, during the last decades Spain has undergone various reforms, including the enactment of the Royal Decree 1299/2006, with important policy implications. Reforms not only promoted the notification of occupational illnesses using harmonized criteria across Spain’s Autonomous Communities, but also added to the list a number of occupational illnesses ignored in previous regulations. Therefore, the reported raise in occupational illnesses might be a natural consequence of these regulatory changes which also bring about important, positive externalities for workers.

Concerning the results by causing agent, from Table 4 it can be seen that Navarra is the region with the highest IR value in Groups 1, 2 and 5, related to chemical, physical agents, and skin illnesses caused by contact with substances and other agents, respectively. Navarra ranks second in Group 4 (inhalation of substances and agents) and sixth in Group 6 (carcinogenic agents) (Table 4). Interestingly, the opposite was found when the number of days away from work is analyzed. For example, Navarra is among the regions with the lowest mean number of days away from work for illnesses included in Group 1 (ranking: 16), Group 2 (ranking: 13) and Group 5 (ranking: 15).

On contrary, Andalusia, Canary Islands, and Madrid (with the exception of illnesses in Group 3 caused by biological agents) consistently report the lowest IR values during the analyzed period (Table 4). Here, Andalusia, together with Canary Islands, Murcia, and Valencia are atop in the ranking of average number of days of work leave (Table 4).

Table 4: Occupational illnesses in Spain’s Autonomous Communities: Causing agents.

Autonomous Community Group 1 Group 2 Group 3 Group 4 Group 5 Group 6
1 Andalusia 1.92 (86.94) 23.55 (102.47) 2.08 (66.77) 2.31 (120.44) 2.07 (71.83) 0.13 (106.04)
2 Aragon 2.95 (83.54) 194.41 (85.90) 3.00 (74.47) 4.39 (133.85) 13.05 (67.03) 0.31 (176.93)
3 Asturias 5.94 (70.18) 92.24 (99.46) 5.07 (35.68) 6.59 (122.45) 9.25 (68.31) 1.06 (174.40)
4 Canary Islands 3.00 (77.31) 36.20 (96.10) 2.20 (69.75) 1.64 (107.06) 4.13 (59.67) 0.02 (40.50)
5 Cantabria 4.23 (34.86) 120.87 (92.48) 3.68 (89.27) 3.61 (89.89) 7.07 (47.86) 0.00 (0.00)
6 Castile La Mancha 4.90 (70.53) 39.10 (80.67) 3.27 (89.33) 4.92 (104.02) 5.84 (60.35) 0.17 (120.61)
7 Castile and Leon 3.24 (87.02) 72.06 (88.06) 3.45 (73.10) 7.24 (107.09) 4.81 (55.98) 0.31 (134.04)
8 Catalonia 4.81 (60.08) 82.02 (89.77) 4.75 (36.71) 3.42 (134.93) 6.57 (53.19) 0.19 (214.90)
9 Madrid 2.01 (56.16) 27.64 (85.97) 8.57 (34.64) 2.28 (82.31) 3.67 (39.53) 0.17 (133.52)
10 Valencia 1.88 (83.25) 107.41 (100.75) 1.83 (67.95) 3.40 (165.18) 3.57 (70.29) 0.22 (217.98)
11 Extremadura 2.74 (58.53) 33.49 (89.56) 5.47 (120.12) 4.55 (111.36) 3.04 (45.21) 0.09 (20.69)
12 Galicia 4.14 (74.99) 88.51 (95.26) 4.06 (57.83) 12.59 (99.26) 6.14 (69.67) 0.30 (143.99)
13 Balearic Islands 2.09 (47.40) 65.35 (79.32) 2.43 (66.56) 2.10 (74.76) 5.98 (38.87) 0.03 (0.00)
14 La Rioja 6.72 (59.31) 228.88 (71.67) 2.18 (26.90) 7.40 (150.70) 9.71 (22.50) 0.37 (0.00)
15 Navarra 15.69 (36.12) 487.38 (85.62) 2.60 (53.87) 10.96 (74.78) 26.85 (39.38) 0.59 (181.12)
16 Basque Country 8.15 (54.28) 269.52 (74.35) 3.43 (73.58) 9.60 (122.51) 12.21 (46.51) 0.83 (241.96)
17 Murcia 3.42 (85.86) 134.14 (95.32) 2.06 (62.53) 2.96 (150.79) 7.54 (85.4) 0.22 (77.25)

Note: Values in parentheses are the mean number of days away from work. Occupational illnesses are grouped by causing agent as follows: 1) Group 1: illnesses caused by chemical agents; 2) Group 2: illnesses caused by physical agents; 3) Group 3: illnesses caused by biological agents; 4) Group 4: illnesses caused by inhalation of substances and agents not included in other sections; 5) Group 5: skin illnesses caused by substances and agents not included in any of the other sections; and 6) Group 6: illnesses caused by carcinogenic agents. Section 3.2 details the agents included in each group.

3.3 Industry patterns of occupational illnesses in Spain

Table 5 presents the results for the incidence rate of occupational illnesses by economic activity, distinguishing between five aggregate industries: primary sectors (agriculture, livestock farming, forestry, and fishing); manufacturing, construction, retail (wholesaling and retail sale), and services (professional and consumer oriented).

Table 5: Occupational illnesses in Spain: Incidence rate by industry.

Primary sector Manufacturing Construction Retail Services
2009 30.95 1336.85 98.33 64.45 506.14
2010 32.41 1278.54 99.98 64.43 496.75
2011 43.62 1228.25 113.92 75.07 566.63
2012 38.89 792.55 117.51 70.09 552.58
2013 46.70 821.34 112.88 80.38 650.43
2014 50.21 925.23 104.33 84.08 655.81
2015 65.41 707.68 112.71 92.79 727.63
2016 69.43 813.35 118.69 98.94 777.93
2017 76.40 792.67 114.28 108.25 769.14
2018 90.72 807.56 117.67 117.41 888.33
2019 113.11 889.74 154.30 137.48 971.69
2020 88.48 663.77 119.75 97.31 636.02

The scrutiny of the industry results shows clearer patterns. Results indicate that manufacturing industries report the highest IR of occupational illnesses during the study period (2009-2020), with the exception of the years 2015, 2018 and 2019 (in these three years’ service sectors showed the highest IR values). This result is consistent with the findings presented in Section 4.1: manufacturing workers often handle different types of equipment and substances used in production processes, which increases the risk of occupational illnesses caused by physical agents (Group 2).

On contrary, from Table 5 it can be observed that, during the entire study period, primary sectors and retail consistently show the lowest and second lowest IR values.

The Mann-Whitney U test was used to verify if the observed disparities in industries’ IR values are different from zero. The results presented in Table 6 confirm that differences in the IR values of occupational illnesses are systematically significant between the analyzed industries.

Table 6: Mann-Whitney U test results: Comparison of the incidence rate of occupational illnesses by industry.

Primary industries Manufacturing Construction Retail Services
Primary industries - -4.157 (0.000) -3.868 (0.000) -2.425 (0.015) -4.137 (0.000)
Manufacturing - 4.157 (0.000) 4.157 (0.000) 2.887 (0.004)
Construction - 2.887 (0.004) -4.157 (0.000)
Retail - -4.157 (0.000)
Services -

Although the high IR of occupational illnesses found for manufacturing sectors, notice that declines in the incidence rate are reported only for this industry group. Between 2009 and 2020, the IR of occupational illnesses in manufacturing industries fell 50.35% (33.45% between 2009 and 2019) (Table 5).

In contrast, primary sectors show the greatest increase in the IR of occupational illnesses: 185.88% between 2009 and 2020 (265.46% between 2009 and 2019). Similarly, increases in the IR of occupational illnesses are observed in retail (50.99% between 2009 and 2020), services (25.66% between 2009 and 2020), and construction sectors (21.78% between 2009 and 2020) (Table 5).


Concluding

4. Discussion, policy implications, and future research

4.1 Discussion and policy implications

The objective of this study was to analyze the temporal evolution of occupational illnesses in Spain during 2009-2020, paying close attention to differences in causing agents as well as to territorial and industry trends.

Overall, the results reveal that occupational illnesses increased between 2009 and 2020, and that there is a connection between the incidence rate of occupational illnesses and the state of the economic cycle. In addition, it was found that the incidence rate of occupational illnesses is the highest for cases caused by physical agents; however, the incidence rate of this type of occupational illnesses declined during the study period. Related, the analysis shows that the rate of occupational illnesses is consistently higher in regions where manufacturing industries-in which workers deal with risks associated to physical agents-have a significant weight in the economy.

The incidence rate of occupational illnesses increased between 2012 and 2019, while this variable drastically fell down by 33% in 2020 as a result of the negative effects of the global Covid-19 pandemic on countries’ economic functioning (in the case of Spain, the paralysis of the activity of most non-essential businesses, and the implementation of working-from-home practices, among others).

Despite the utter simplicity of the proposed analysis, relevant implications can be extracted from this study.

From a policy perspective, the reported increase in the rates of occupational illnesses should not be interpreted as bad news. On the one hand, legal reforms in occupational health and safety introduced by Spain’s government in 2006 (Royal Decree 1299/2006) have relevant implications. This regulatory change created a common framework that facilitates the notification of occupational illnesses using harmonized criteria across Spain’s regions

The empirical manifestation of this reform is the temporal convergence of cases of occupational illnesses with and without work leave after 2007. In addition, the new regulatory framework includes a number of occupational illnesses and causing agents ignored in previous regulations. As a result, the reported increase in occupational illnesses might be a natural consequence (in my interpretation, a positive externality) of the new regulation, which constitutes a sign that the level of protection of Spanish workers improved, in terms of occupational health and safety at the workplace.

On the other hand, the reported temporal pattern of the rate of occupational illnesses is in line with previous work suggesting a pro-cyclical trend between work accidents (and illnesses) and the state of the economy (Asfaw et al., 2011; Gerdtham & Ruhm, 2006; Fernández-Muñiz et al., 2018; Lafuente & Abad, 2021).

4.2 Future research

As with any study, the analysis presented in this research is open to further verification. First, detailed data at the industry level on the distribution of occupational illnesses by causing agent was not available. This limited the analytical scope of the study as it is not possible to determine if environmental conditions idiosyncratic to a territory (e.g., configuration of the local industrial fabric and workers’ human capital level) or specific policy aspects (e.g., regional policy and deployment of public resources) have a distinctive effect in the incidence rate of occupational illnesses across Spanish regions. Future work should address this issue by evaluating the association between businesses’ activity (i.e., industry) and the incidence of occupation illnesses in order to reconcile the work of safety inspections with the timely implementation of solutions that reduce the risks of occupational illnesses in specific industries.

Second, future work should conduct an exhaustive study of the evolution of the incidence of occupational illnesses in the post-Covid pandemic period, paying special attention to potential notification delays and their effect on workers’ health. Related, future studies should consider the potential risks associated with new work practices that gained relevance during the Covid-19 pandemic-i.e., working from home-and that will likely become the ‘new normal’ for many organizations.

Annex 1

Acknowledgements:

This study is part of the author’s thesis for her master studies (Master en Gestión de la Edificación, MUGE) at the Barcelona School of Building Construction (EPSEB), Polytechnic University of Catalonia (UPC Barcelona Tech). The author is thankful to Esteban Lafuente (UPC Barcelona Tech) for insightful comments that contributed to significantly improve the study


References

References


Asfaw, A., Pana-Cryan, R., & Rosa, R. (2011). The business cycle and the incidence of workplace injuries: evidence for the U.S.A., Journal of Safety Research, 42, 1-8. https://doi.org/10.1016/j.jsr.2010.10.008

Bhattacharya, A. (2014). Costs of occupational musculoskeletal disorders (MSDs) in the United States. International Journal of Industrial Ergonomics, 44(3), 448-454. https://doi.org/10.1016/j.ergon.2014.01.008

Bofinger, C. (2005). Health Tracking Project-The Development of a National Framework for Managing Occupational Illness and Disease in the Australian Minerals Industry. In Aziz, N (ed.), Coal 2005: Coal Operators’ Conference, University of Wollongong & the Australasian Institute of Mining and Metallurgy (pp. 123-128).

Boletín Oficial del Estado de España (BOE) (2015). Real Decreto Legislativo 8/2015, de 30 de octubre, por el que se aprueba el texto refundido de la Ley General de la Seguridad Social. No. 261, October 31 2015. Reference: BOE-A-2015-11724.

Boone, J., van Ours, J.C., Wuellrich, J.P., & Zweimüller, J. (2011). Recessions are bad for workplace safety. Journal of Health Economics, 30, 764-773. https://doi.org/10.1016/j.jhealeco.2011.05.013

Cioni, M., & Savioli, M. (2016). Safety at the workplace: accidents and illnesses. Work, Employment and Society, 30 (5), 858-875. https://doi.org/10.1177/0950017015590759

Dembe, A.E., Erickson, J.B., Delbos, R.G., & Banks, S.M. (2005). The impact of overtime and long work hours on occupational injuries and illnesses: new evidence from the United States. Occupational and Environmental Medicine, 62 (9), 588-597. https://dx.doi.org/10.1136/oem.2004.016667

European Commission (2021). EU strategic framework on health and safety at work 2021-2027 Occupational safety and health in a changing world of work. Communication from the Commission to the European Parliament, the Council, the European Economic and Social Committee and the Committee of the Regions. Brussels, June 28 2021.

Fernández-Muñiz, B., Montes-Peón, J.M., & Vázquez-Ordás, C.J. (2018). Occupational accidents and the economic cycle in Spain 1994-2014. Safety Science, 106, 273-284. https://doi.org/10.1016/j.ssci.2016.02.029

Gerdtham, U.G., & Ruhm, C.J. (2006). Deaths rise in good economic times: evidence from the OECD. Economics and Human Biology, 4, 298-316. https://doi.org/10.1016/j.ehb.2006.04.001

Instituto Nacional de Seguridad e Higiene en el Trabajo (INSHT) (2017). Fundamentos para la prevención de riesgos laborales. ISBN 978-84-7425-824-0. Barcelona, Mayo.

International Labor Organization (ILO) (2019). Safety and Health at the Future of Work: Building on 100 years of experience. ISBN: 978-92-2-133155-1 (pint version), ISBN: 978-92-2-133156-8 (web version). Available at: https://www.ilo.org/global/topics/safety-and-health-at-work/events-training/events-meetings/world-day-for-safety/WCMS_687610/lang--en/index.htm

Kalleberg, A.L. (2012). Job quality and precarious work: clarifications, controversies, and challenge. Work and Occupations, 39(4), 427-448. https://doi.org/10.1177/0730888412460533

Kivimäki, M., Jokela, M., Nyberg, S.T., Singh-Manoux, A., Fransson, E.I., Alfredsson, L., Bjorner, J.B., Borritz, M., Burr, H., Casini, A., & Clays, E. (2015). Long working hours and risk of coronary heart disease and stroke: a systematic review and meta-analysis of published and unpublished data for 603838 individuals. The Lancet, 386 (10005), 1739-1746. https://doi.org/10.1016/S0140-6736(15)60295-1

Lafuente, E., & Abad, J. (2021). Territorial efficiency: Analysis of the role of public work safety controls. Safety Science, 134, 105074. https://doi.org/10.1016/j.ssci.2020.105074

Lafuente, E., & Daza, V. (2020). Work inspections as a control mechanism for mitigating work accidents in Europe. TEC Empresarial, 14(1), 26-37. https://doi.org/10.18845/te.v14i1.4953

Leigh, J.P., Cone, J.E., & Harrison, R. (2001). Costs of occupational injuries and illnesses in California. Preventive Medicine, 32, 393-406. https://doi.org/10.1006/pmed.2001.0841

Muula, A.S., Rudatsikira, E., & Siziya, S. (2010). Occupational illnesses in the 2009 Zambian labour force survey. BMC Research Notes, 3(1), 1-7. https://doi.org/10.1186/1756-0500-3-272

Noe, R., Cohen, A. L., Lederman, E., Gould, L. H., Alsdurf, H., Vranken, P., Ratard, R., Morgan, J., Norton, S.A., & Mott, J. (2007). Skin disorders among construction workers following Hurricane Katrina and Hurricane Rita: an outbreak investigation in New Orleans, Louisiana. Archives of Dermatology, 143(11), 1393-1398. https://doi.org/10.1001/archderm.143.11.1393

Piore, M.J., & Schrank, A. (2018). Root-Cause Regulation: Protecting Work and Workers in the Twenty-First Century. Harvard University Press, Cambridge, MA.

Quandt, S.A., Grzywacz, J.G., Marin, A., Carrillo, L., Coates, M.L., Burke, B., & Arcury, T.A. (2006). Illnesses and injuries reported by Latino poultry workers in western North Carolina. American Journal of Industrial Medicine, 49(5), 343-351. https://doi.org/10.1002/ajim.20299

Stocks, S. J., McNamee, R., Turner, S., Carder, M., & Agius, R. M. (2012). Has European Union legislation to reduce exposure to chromate in cement been effective in reducing the incidence of allergic contact dermatitis attributed to chromate in the UK? Occupational and Environmental Medicine, 69(2), 150-152. https://dx.doi.org/10.1136/oemed-2011-100220

Takala, J., Hämäläinen, P., Saarela, K.L., Yun, L.Y., Manickam, K., Jin, T.W., Heng, P., Tjong, C., Kheng, L.G., Lim, S., & Lin, G.S. (2014). Global estimates of the burden of injury and illness at work in 2012. Journal of Occupational and Environmental Hygiene, 11(5), 326-337. https://doi.org/10.1080/15459624.2013.863131

Toivanen, S., Härter Griep, R., Mellner, C., Nordenmark, M., Vinberg, S., & Eloranta, S. (2019). Hospitalization due to stroke and myocardial infarction in self-employed individuals and small business owners compared with paid employees in Sweden-a 5-year study. Small Business Economics, 53(2), 343-354. https://doi.org/10.1007/s11187-018-0051-3

Trinkoff, A.M., Le, R., Geiger-Brown, J., Lipscomb, J., & Lang, G. (2006). Longitudinal relationship of work hours, mandatory overtime, and on-call to musculoskeletal problems in nurses. American Journal of Industrial Medicine, 49 (11), 964-971. https://doi.org/10.1002/ajim.20330

Turjanmaa, K. (1987). Incidence of immediate allergy to latex gloves in hospital personnel. Contact Dermatitis, 17(5), 270-275. https://doi.org/10.1111/j.1600-0536.1987.tb01476.x

Zorba, E., Karpouzis, A., Zorbas, A., Bazas, T., Zorbas, S., Alexopoulos, E., Zorbas, I., Kouskoukis, K., & Konstandinidis, T. (2013). Occupational dermatoses by type of work in Greece. Safety and Health at Work, 4(3), 142-148. https://doi.org/10.1016/j.shaw.2013.06.001