Article
DOI: 10.18845/te.v17i1.6433


The relationship between the economic cycle and work accidents in the United States: A time series analysis


La relación entre el ciclo económico y los accidentes de trabajo en Estados Unidos: un análisis de series temporales


TEC Empresarial, Vol. 17, n°. 1, (Janury - April, 2023), Pag. 1 - 17, ISSN: 1659-3359


Article received: 28 July, 2022 - Article accepted: 24 October, 2022

AUTHORS

Manfred Murrell-Blanco ORCID

Escuela de Administración de Empresas, Instituto Tecnológico de Costa Rica (TEC), Cartago, Costa Rica. Escuela de Ciencias Ambientales, Universidad Nacional (UNA), Heredia, Costa Rica. mailto:manfred.murrell.blanco@una.ac.cr. Email


ABSTRACT

Abstract

This study analyzes the relationship between the economic cycle and work accidents in the United States. The empirical strategy is based on vector autoregression models (VAR) for time series and panel-data settings on a sample of 40 US States during 2003-2018. The results confirm a bidirectional causal relationship in the shortrun between economic activity—i.e., Gross Domestic Product (GDP) per worker—and work accidents in 28 States. Additionally, the empirical evidence suggests that this relationship is heterogeneous. In line with increased awareness on how the economic cycle affects the temporal trajectory of work accidents across territories, policy implications and future research avenues are discussed.

Keywords: Work accidents rate, economic cycle, causal relationship, time series.

Resumen

Este estudio analiza la relación entre el ciclo económico y la siniestralidad laboral en Estados Unidos (EE. UU). La estrategia empírica se basa en modelos vectoriales de autorregresión para series temporales y configuraciones de datos de panel en una muestra de 40 estados de EE. UU. durante 2003-2018. Los resultados confirman una relación causal bidireccional en el corto plazo entre la actividad económica, es decir, el Producto Interno Bruto por trabajador, y los accidentes laborales en 28 estados. Además, la evidencia empírica sugiere que esta relación es heterogénea. En línea con una mayor conciencia sobre cómo el ciclo económico afecta la trayectoria temporal de los accidentes relacionados con el trabajo en los territorios, se discuten las implicaciones políticas y las futuras vías de investigación.

Palabras clave: Siniestralidad laboral, ciclo económico, relación de causalidad, serie temporal


Introduction

1. Introduction


This study evaluates the dynamic connections and potential causal relationships between macroeconomic figures linked to the economic cycle (i.e., gross domestic product (GDP) per worker) and work-related accidents in the United States during 2003-2018.

Work accidents have a major impact on workers and their families (GBD 2016 Occupational Risk Factors Collaborators (2020); GBD 2019 Diseases and Injuries Collaborators (2021). The costs of work accidents surpass economic figures and cover other more intangible aspects related to workers’ physical and psychological wellbeing in the short- and long-run (Takala et al., 2014; Hämäläinen et al., 2017; Piore & Schrank, 2018). Also, the productivity declines and disruptions in production processes that follow work accidents significantly damage business performance and, subsequently, territorial economic outcomes (Lafuente & Abad, 2021). Global figures made available by the ILO (2019) estimate that 374 million workers suffer from work accidents every year with an associated economic cost that represent roughly 4% of world’s GDP. The situation in the United States is equally tragic: the US Occupational Safety and Health Administration estimated that work-related accidents cost workers, businesses, and public administrations around US$171 billion in 2019 (URL: https://www.osha.gov/businesscase).

Occupational health and safety policies and practices are fundamental pillars for securing safer work environments and stimulating social wealth (Piore & Schrank, 2018). As a result, the territorial analysis of the relationship between the economic cycle and work accident rates has gained momentum among social planners, scholars, and managers (Davies et al., 2009; Li et al., 2011; Wu et al., 2018; ILO, 2019; Lafuente & Abad, 2021).

Empirical studies dealing with the analysis of the connection between the economic cycle and work accident rates often assume that these variables are intrinsically associated over time (Lafuente & Daza, 2020). Two narratives are the most prominent when it comes to theorizing the complex relationships between economic fluctuations and work accidents. First, the dominant narrative supporting the cyclical relationship between territories’ economic outputs and work accidents is rooted in the pioneering work by Kossoris (1938) . In this debate, it is argued that the economic cycle (expansion or recession stage) conditions businesses’ activity-in terms of resource exploitation and labor intensification-and, consequently, the temporal trajectory of work accident rates across territories. When the economy is growing businesses tend to increase production and employment figures to satisfy market demands. The intensification of productive activities will manifest in higher workloads (and stress and fatigue) and less attention to safety practices; thus, increasing both the exposure to work risks and work accidents (Dembe et al., 2005; Trinkoff et al., 2006; Lafuente & Abad, 2021). Existing research supports this argument. Gerdtham and Ruhm (2006) and Davies et al. (2009) found that in growth periods the increase in employment figures is accompanied by a greater reporting of work accidents. Also, Cioni and Savioli (2016) showed that poor working conditions are the main determinant of work accidents and occupational illnesses.

Second, the workers’ vulnerability approach by Nichols (1989) proposes various behavioral traits and labor-market factors to explain the fall in work accident rates in recession periods. In this sense, job insecurity increases in periods of economic decline, and studies suggest that the positive correlation between the economic cycle and work accidents during periods of economic downturn is caused by the lower willingness of workers to report accidents due to their market vulnerability (claim reporting effect linked to the fear of losing the job) (Nichols, 1989; Ruhm, 1996; Boone & van Ours, 2006). For example, using a unique matched (worker-firm) dataset on work accidents, Boone et al. (2011) found that, in Austria, economic recessions influence the reporting of moderate workplace accidents, that is, if workers perceive a higher probability of dismissal, they are less likely to report a moderate work accident.

But, at the territorial level various sources of heterogeneity-e.g., labor intensity and differences in work safety regulations across territories-might influence the temporal connection between macroeconomic figures and work accidents. In this sense, the statistical significance of the relationship between the economic cycle and the rate of work accidents is often presented as an indirect test of the effectiveness of work safety policy and practices (Dembe et al., 2005; Davies et al., 2009; Boone et al., 2011; Lafuente & Abad, 2021).

In the specific context of this study, important questions remain unanswered: is there a causal relationship between economic activity and work accidents in the US? And, if so, are the analyzed causality effects consistent across US States?

To answer these questions empirically, this study uses vector autoregression (VAR) models and Granger causality tests to verify the relationship between the economic cycle and work accident rates on a sample of 40 US States from 2003 to 2018.

The USA setting is attractive for various reasons. First, access to detailed data on work accidents allows to carry out a comprehensive analysis of the potentially causal relationship between the state of the economy and work accidents. Thus, this study updates the relatively limited evidence on the statistical connection between the economic cycle and work accident rates that is available for the US (Ruhm, 1996; Dembe et al., 2005; Leigh, 2011).

Second, by scrutinizing the potentially causal relationship between economic fluctuations (measured by changes in GDP per worker) and the rate of work accidents, this study offers the opportunity to assess the effects of the evolution of territories’ economic performance in contexts where the causes and consequences of work accidents are complex and heterogeneous.

Finally, by analyzing the connection between economic activity and work accidents this study sheds light on the importance of accounting for the configuration of the local industrial fabric when it comes to design occupational health and safety (OHS) policies that may contribute to reduce work accidents and, ultimately, lead to a greater economic consolidation.

The plan of the paper is organized as follows. Section 2 deals with the data and the description of the analytical method. Section 3 presents the empirical results, while Section 4 offers the concluding remarks, implications, and future research lines.

2. Data and empirical strategy

2.1 Data and variable definition

The data used in this study come from two sources of information. First, data on macroeconomic figures-i.e., Gross Domestic product (GDP)-was obtained from the Bureau of Economic Analysis databases (https://www.bea.gov/data/gdp). Second, the information on the number of work-related accidents was collected from the Bureau of Labor Statistics databases (https://www.bls.gov/iif/oshcdnew.htm).

This study evaluates the relationship between economic cycle (measured as variations in GDP) and work accidents in 40 States over the period 2003-2018. Table 1 summarizes the States included in the analysis according to the territorial segmentation set by the USA Census Bureau (URL: https://www.census.gov/programs-surveys/economic-census/guidance-geographies/levels.html).

Table 1: Sample: US States considered in the study.

Region Division States
Northeast New England Connecticut*, Maine*, Massachusetts*, New Hampshire, Rhode Island, Vermont*
Middle Atlantic New Jersey*, New York*, Pennsylvania
Midwest East North Central Illinois*, Indiana*, Michigan*, Ohio, Wisconsin*
West North Central Iowa*, Kansas*, Minnesota*, Missouri*, Nebraska*, North Dakota, South Dakota
South South Atlantic Delaware*, District of Columbia*, Florida, Georgia*, Maryland*, North Carolina*, South Carolina*, Virginia*, West Virginia*
East South Central Alabama*, Kentucky*, Mississippi, Tennessee*
West South Central Arkansas*, Louisiana*, Oklahoma, Texas*
West Mountain Arizona*, Colorado, Idaho, Montana*, Nevada*, New Mexico*, Utah*, Wyoming*
Pacific Alaska*, California*, Hawaii*, Oregon*, Washington*

The key study variables are the rate of work accidents and the GDP per worker. In the case of the former, the work accident rate is defined as the total number of work-related accidents divided by the total number of workers in the economy. It is worth mentioning that this variable represents the number of work-related accidents (i.e., minor and major injuries) and occupational illnesses per 100 full-time equivalent workers which is calculated as (N/EH) x 200,000, where N is the number of injuries and illnesses, EH is the total number of hours worked by all employees during the calendar year, and 200,000 is the base number of yearly working hours for 100 full-time equivalent workers (working 40 hours per week during 50 weeks).

Concerning the macroeconomic data, the States’ economic activity or output is measured by the GDP per worker. This variable, which is a proxy of labor productivity, has been extensively used in economic studies dealing with territories’ economic performance (Caselli & Coleman, 2006; Lafuente et al., 2020). Descriptive statistics in levels and log differences are presented in Table 2.

Table 2: Descriptive statistics for the selected variables (US aggregate data during 2003-2018)

Variables in levels Variables in differences
ln work accident rate (per worker) ln GDP per worker (thousand US$) ∆ work accident rate ∆ GDP per worker
2003 5.1126 122.69 0.0185
2004 4.8744 125.69 -0.0477 0.0241
2005 4.7812 128.06 -0.0193 0.0187
2006 4.5736 128.00 -0.0445 -0.0006
2007 4.3758 128.62 -0.0441 0.0049
2008 4.0350 128.16 -0.0812 -0.0036
2009 3.7637 131.58 -0.0695 0.0263
2010 3.6866 137.19 -0.0207 0.0418
2011 3.5855 137.68 -0.0178 0.0035
2012 3.4862 136.85 -0.0281 -0.0059
2013 3.3777 135.34 -0.0317 -0.0111
2014 3.2563 135.19 -0.0365 -0.0011
2015 3.1003 135.88 -0.0491 0.0051
2016 3.0295 135.23 -0.0232 -0.0048
2017 2.9411 136.29 -0.0295 0.0078
2018 2.9256 137.87 -0.0084 0.0115

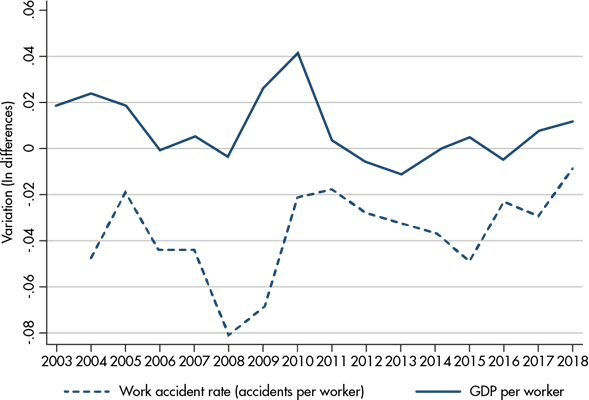
For illustrative purposes, a first descriptive indication of the potential cyclical relationship between work accidents and economic activity is presented in Figure 1. For ease of interpretation, the figure shows the variation rate in both study variables-i.e., rate of work accidents and GDP per worker-over the analyzed period. Previewing the results, the figure suggests that fluctuations in the analyzed variables follow a similar trajectory over time.

Figure 1: Temporal evolution of the work accident rate and the GDP per worker in the US

v17n1a01image001.png

2.2 Empirical strategy

This study emphasizes the relationship between economic activity and the rate of work accidents in the United States. To achieve this objective, I followed a two-step methodology based on vector autoregression models (VAR) for time series (Sims, 1980) and panel-data settings (Holtz-Eakin et al., 1988).

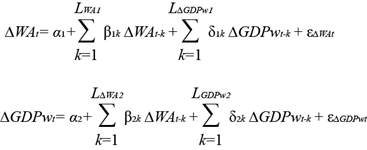
In the first stage, a standard VAR model is used to analyze the connection between the aggregate (USA level) time series of variations in GDP per worker and changes in work accident rates. Here the balanced VAR model-i.e., with the same lag length for all variables-has the following form:

v17n1a01image002.png

(1)

In the full specification presented in equation (1) ∆WA is the variation in the work accident rate and ∆GDPw is the variation in GDP per worker during the study period (t = 1, ,T). The coefficients α are the intercepts, while β and δ are parameters capturing the short-run effect on the dependent variable of the variables ∆WA and ∆GDPw, respectively. The terms ε are the flat noise of the VAR model. Notice that in each equation the short-run effect (SR) is defined as the sum of the coefficients of all variables lagged k periods (for example, the short-run effect of ∆GDPw on ∆WA in the ∆WA equation is v17n1a01image003.png) (Lütkepohl, 1993).

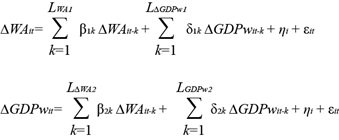
Second, I employ a panel-data VAR model (Holtz-Eakin et al., 1988) to study the connection between variations in GDP per worker and changes in the rate of work accidents at the State level (i= 1, ,N). In this case the following panel VAR model is used:

v17n1a01image004.png

(2)

Keeping the notation used in equation (1), in equation (2) ∆WA is the variation in the work accident rate, ∆GDPw is the variation in GDP per worker, the terms β and δ are vectors of parameters to be estimated, ηi is the State-specific fixed effects term, and εit is the idiosyncratic error term. Following Holtz-Eakin et al. (1988) , the panel-data VAR model in equation (2) assumes that, for the studied States, coefficients (β and δ) are estimated by a homogeneous data generation process. Equation (2) is computed using the GMM estimator (Arellano & Bond, 1991).

With model estimations in hand (equations (1) ad (2)), the Granger causality Wald test (Abrigo & Love, 2016), which evaluates whether one times series is useful in forecasting another (null hypothesis: all parameters on the lag of the study variables are jointly zero in each equation), is used to verify a causal relationship between economic activity and work accident rates. Results are presented in the next section.

Results

3. Results

Before reporting the study results, unit root tests were performed on the data to evaluate stationarity in the time series. Table 3 presents the results for both the augmented Dickey-Fuller test (US time series) and the panel unit root tests (Im-Pesaran-Shin test) (Im et al., 2003). Overall, the results of the unit root tests indicate that the two data sets used in this study are stationary; thus, validating the use of the Granger causality test to study potentially causal relationships between GDP per worker and the rate of work accidents. The findings of the causality tests are presented in Sections 4.1 and 4.2.

Table 3: Unit root tests: Summary results

1 lag 2 lags 3 lags
Panel A: Unit root test (aggregate data) (Augmented Dickey-Fuller test)
△ Work accident rate -2.883 (0.026) -3.343 (0.059) -4.098 (0.028)
△ GDP per capita -3.086 (0.028) -2.836 (0.071) -2.586 (0.096)
Panel B: Panel unit root tests (Im-Pesaran-Shin test)
△ Work accident rate -9.057 (0.000) -3.998 (0.000) -3.633 (0.001)
△ GDP per capita -4.633 (0.000) -2.498 (0.006) -5.649 (0.000)

All results are based on CADF regressions that include an intercept and a time trend. Values in parenthesis are the p-values of the unit root tests. For all variables the results indicate that the null hypothesis of non-stationarity (against the alternative of trend stationarity) is rejected at conventional significance levels.

3.1 Baseline results: Work accident rates and GDP per worker

Table 4 shows the results of the VAR model (equation (1)), whereas the findings of the Granger causality test evaluating the relationship between economic activity (variations in GDP per worker) and changes in work accident rates are shown in Table 5. In constructing stationary vector autoregression models, the determination of the lag length and the evaluation of the stability of parameters are two important issues. Thus, to ensure the goodness of fit of the model various diagnostic (i.e., optimal lag-length and normality of errors) and stability tests were conducted.

Table 4: VAR regression: Short-run results

△ Work accident rate △ GDP per capita
△ Work accident rate (lag 4) -4.395*** (3.24) -1.154*** (6.10)
△ GDP per capita (lag 4) 1.264** (2.22) 0.398*** (5.01)
Intercept -0.261*** (3.60) -0.130*** (12.85)
Chi2 test (p-value) 36.598*** (0.000) 1190.911*** (0.000)
R squared 0.7689 0.9908
RMSE 0.0239 0.0033
Model diagnostics:
Log likelihood value 96.2654
AIC -14.2301
Jarque-Bera normality test for errors (chi2 value) 0.2880 (p-value= 0.8659)

Note: STATA command used is to compute the results = ‘var’. For regression coefficients absolute t-values are presented in parentheses. *, **, *** indicate significance at 10%, 5% and 1%, respectively.

Concerning the diagnostic tests, the Akaike Information Criterion (AIC) was used to select the optimal lag length of the variables to balance the trade-off between the goodness of fit and the complexity of the model, while offering results that accurately capture the dynamic relationship among the analyzed variables (Lütkepohl, 2006). For the two variables the results indicate that the optimal lag length is 4. Notice that alternative selection criteria based on the Schwarz’s Bayesian Information Criterion (SBIC) and the Hannan and Quinn Information Criterion (HQIC) produce the same optimal lag length result. Additionally, the result of the Jarque-Bera normality test presented in Table 4 (Chi2 value = 0.2880 and p-value = 0.8659) indicate that the errors generated by the VAR model are normally distributed.

The eigenvalues produced by the VAR model were scrutinized to verify model stability. The results of the eigenvalue stability condition test reveal that all eigenvalues are below unity, which corroborates that the VAR model presented in equation (1) satisfies the stability condition (range: 0.4884-0.9855).

The results of the VAR model in Table 4 point to a solid bidirectional short-run relationship between changes in GDP per worker and variations in work accident rates between 2004 and 2018.

Specifically, when the variation in the rate of work accidents (∆WA) is the dependent variable, the coefficient linked to changes in GDP per worker is positive and statistically significant, which indicates that a 1% increase in GDP per worker would produce an estimated increase of 1.264% in the rate of work accidents. Therefore, it can be concluded that variations in the economic cycle-proxied by GDP per worker-has is positively correlated with work accident rates in the short-run.

The findings for the specification modeling changes in GDP per worker (∆GDPw) suggest a strong negative effect of variations in the rate of work accidents on variations in GDP per worker. In this case, the result of the parameter indicates that a 1% increase in the work accident rate would produce an estimated fall of 1.154% in the GDP per worker.

The connections between the economic cycle and work accidents presented in Table 4 are corroborated by the results of the Granger causality test in Table 5: the evidence reveals a bidirectional causal relationship in the short-run between GDP per worker and work accident rates.

Table 5:Granger causality test: Summary results

Null hypothesis: F-statistic p-value Verdict
△ GDP per capita does not Granger-cause △ Work accident rate 21.18*** 0.0000 x→y
△ Work accident rate does not Granger-cause △ GDP per capita 823.06*** 0.0000 x→y

The table reports the results of the Granger non-causality test with four lags on the data series (STATA command = ‘vargranger’). The ‘Verdict’ column summarizes the results of the test: x→y indicates that the focal independent variable ‘does Granger cause’ the dependent variable, and x→y indicates that the focal independent variable ‘does not Granger cause’ the dependent variable. *, **, *** indicate significance at the 10%, 5% and 1%, respectively.

The results in Tables 4 and 5 are in accordance with previous work. On the one hand, the pro-cyclical relationship between the economic cycle and work accident rates supports Kossoris’ (1938) intensification theory which proposes that in periods of economic growth employment rates increase and, subsequently, the number of hours worked and the exposure to work-related risks (Gerdtham & Ruhm, 2006; Trinkoff et al., 2006; Davies et al., 2009). On the other hand, the effect of work accidents on economic performance is in line with previous work highlighting the negative economic and social consequences of work accidents for territories’ productivity (Lafuente & Abad, 2021).

3.2 Work accident rates and GDP per worker: State results

This section presents the results of the panel-data VAR model (equation (2)) (Tables 6 and 7) for the analyzed US States. Similar to the time-series VAR analysis (Section 4.1), diagnostic and stability tests were conducted to ensure the goodness of fit of the proposed model.

Concerning the diagnostic tests, moment model selection criteria (MMSC) were used to determine the optimal lag length for the States’ panel vectors (Andrews & Lu, 2001).

For the panel-data used in this study, the result of the moment Akaike Information Criterion (MAIC) indicates that the optimal lag length is 1. The same optimal lag length was obtained by applying the moment Bayesian Information Criterion (MBIC) and the moment Hannan and Quinn Information Criterion (MHQIC). Additionally, the result of the Jarque-Bera normality test presented in Table 6 (Chi2 value = 4.8640 and p-value= 0.0879) weakly reject that the errors generated by the panel VAR model are normally distributed.

The results of the eigenvalue stability condition show that all eigenvalues are below unity, which confirms the stability and validity of the proposed panel-data VAR model (range: 0.0930-0.1777).

Despite the significance of coefficients is weaker than that of parameters computed via the time-series VAR (Table 4), the results of the panel VAR model in Table 6 are qualitatively similar to those reported for the time-series VAR: at the State level, it was found a bidirectional relationship between changes in GDP per worker and variations in work accident rates between 2004 and 2018.

In the case of the equation modeling the variation in the rate of work accidents (∆WA), the coefficient associated with variations in GDP per worker indicates that a 1% increase in GDP per worker would increase the rate of work accidents by 0.223%. That is, changes in the economic cycle are positively correlated with the rate of work accidents in the short-run.

When the dependent variable is the change in GDP per worker (∆GDPw), the findings in Table 6 show a strong negative effect of changes in the rate of work accidents on variations in GDP per worker: the result of the coefficient indicates that a 1% increase in the work accident rate would translate into an estimated fall of 0.453% in the GDP per worker.

The results in Table 7 for the Granger causality Wald test after the panel VAR model corroborate the findings reported in Table 5 for the US time-series: there is a bidirectional causal relationship in the short-run between the economic cycle and work accidents at the State level.

Table 6: Panel VAR regression: Summary results.

△ Work accident rate △ GDP per capita
△ Work accident rate (lag 1) -0.211*** (3.77) -0.453** (2.31)
△ GDP per capita (lag 1) 0.223* (1.86) 0.126** (2.22)
Model diagnostics:
MAIC -12.7716
Jarque-Bera normality test for errors (chi2 value) 4.8640 (p-value= 0.0879)

Note: STATA command used is to compute the results = pvar. For regression coefficients absolute t-values are presented in parentheses. *, **, *** indicate significance at 10%, 5% and 1%, respectively.

Table 7: Granger causality test after panel VAR model: Summary results

Null hypothesis: F-statistic p-value Verdict
△ GDP per capita does not Granger-cause △ Work accident rate 3.47* 0.0630 x→y
△ Work accident rate does not Granger-cause △ GDP per capita 5.35** 0.0210 x→y

Table A1 in the Appendix shows the results of the Granger causality test evaluating the relationship between GDP per worker and changes in work accident rates at State level. The evidence reveals that the general model estimated for the USA-which identifies a bidirectional causal relationship in the short-run between economic activity and work-related accidents-is present in 28 States. This represents 70 % of the total US States included in the final sample.

Looking at the results for the geographic areas set by the USA Census Bureau indicates, it was found that two divisions (West North Central and Pacific) show the same trajectory identified for the entire country. According to the Bureau of Economic Analysis, the US States in those divisions have mainly developed businesses in sectors associated with manufacturing, real estate and rental and leasing, and professional and business services (URL: https://www.bea.gov).

Compared to findings in Table 5, slightly different results are reported for various US States: Maine and Vermont (New England division), New York (Middle Atlantic division), Illinois and Michigan (East North Central division), Alabama (East South Central division), Texas (West South Central division) and Montana (Mountain division). This is possibly associated with particularities in their territorial industry structure. For example, New York, which is considered the world’s financial epicenter, headquarters five of the country’s ten largest banks, including Morgan Stanley, Citigroup, and JPMorgan Chase. The Granger causality test in this State indicate that changes in GDP per worker ‘does Granger cause’ work-related accident, but changes in work accidents ‘does not Granger cause’ effects on GDP.

A similar result was found for Texas, a State with a large economy comparable to Australia, Mexico, Spain or Russia according to data made available by the International Monetary Fund (URL: https://www.imf.org). In this case, the State’s economic activity is primarily boosted by several large corporations, including, among others, ExxonMobil, AT&T, Sysco, and American Airlines.

The opposite finding was reported for Alabama, which shows that changes in GDP per worker ‘does not Granger cause’ work-related accident, but changes in work accidents ‘does Granger cause’ effects on GDP. Here, Alabama’s most representative job boosters between 2010 and 2017 were administrative and waste services, accommodation, food service, arts and entertainment, and manufacturing and transportation (URL: https://www.bea.gov).

The geographic division with the greatest internal difference compared to the national trend is the South Atlantic, where the Granger causality test indicates that changes in GDP per worker ‘does Granger cause’ work-related accident, while changes in work accidents ‘does not Granger cause’ effects on GDP. This is the case of Georgia, Maryland and North Carolina. On contrary, for South Carolina changes in GDP per worker ‘does not Granger cause’ work-related accident, but changes in work accidents ‘does Granger cause’ effects on GDP. The top industries in Georgia, Maryland and North Carolina are real estate and rental and leasing, professional and business services, and manufacturing. South Carolina shows a similar industrial configuration; however, in this State tourism is an important economic booster, with travelers visiting many of the State’s beach towns (e.g., Charleston, Hilton Head, and Myrtle Beach) (URL: https://www.usnews.com/news/best-states/south-carolina).


Concluding

4. Concluding remarks, implications, and future research

4.1 Concluding remarks

Rooted in the theoretical approaches by Kossoris (1938) and Nichols (1989) , this study evaluates the potential causal relationship between economic activity and work accidents in the USA during 2003-2018, while questioning if such potential effects are consistent across the US States. Answering these questions is relevant in light of the impacts of occupational accidents on both workers’ quality of live and business performance (Davies et al., 2009; García-Serrano et al., 2010; Lo et al., 2014; Andersen et al., 2018; Lafuente & Abad, 2021).

To achieve this goal, this study employs data gathered from the US Bureau of Economic Analysis and the US Bureau of Labor Statistics for the period 2003-2018.

Overall, the results corroborate the statistical connections between macroeconomic figures and work-related accidents reported in previous work (Boone et al., 2011; Sedano-de la Fuente et al., 2014; Lafuente & Daza, 2020; Lafuente & Abad, 2021). Additionally, it was found that the reported trajectory for the US data is not entirely shared by US States, that is, heterogeneous patterns were identified when connecting the economic activity and work accidents across US States, a result that I link to territorial discrepancies in terms of the configuration of States’ industrial fabric.

4.2 Implications

This paper has relevant implications for scholars and social planners. First, from an academic perspective, this study is strict related with prior research showing that variables linked to the economic cycle (i.e., GDP per worker) affect the temporal trajectory of work accidents rates across territories (Li et al., 2011; Lafuente & Abad, 2021). This outcome is connected to the first research question of this paper (‘Is there a causal relationship between economic activity and work accidents in the USA?’).

In connection with the second research question (‘are the analyzed causality effects consistent across the US States?’), the empirical evidence suggests that this relationship is heterogeneous across US territories. Similar to Cornelissen et al. (2017) , it was found that the dissimilar findings might be associated with the relative weight of different industries across US States, and marked effects were observed in territories where dominants industries are considered archetypal examples of accident-prone sectors.

From a policy viewpoint, the solid bidirectional short-run relationship between changes in GDP per worker and variations in work accident rates is evidence of causality. At the territory level, this logic implies that policy decisions affecting the mechanisms that govern the US State’s safety system should be connected to the economic cycle. On the other hand, relevant policy lessons can be extracted from the findings. For example, policy makers should consider the territorial heterogenicity to grapple with competing demands, including the coordinated design of policies targeting societal objectives (e.g., reducing work accidents) and meeting collective goals that can improve the economic condition of the population (e.g., enhance the local GDP) (Lafuente & Abad, 2021). Therefore, I suggest that policy makers should devote more attention to the business structure at US State level to enhance the efficient use of available resources and improve the safety policies and practices. For example, by analyzing the statistics available on work accidents and labor intensity related to every industry.

4.3 Future research avenues

The findings presented in this paper are open to further verification. First, the collected data in this study neither allow for analyzing more extended periods nor the complete USA extension. Further research can address this issue by pursuing the study when the required information is available. This will provide an extended picture of how the economic cycle affects work-related accidents at the country level.

Second, it is not entirely clear the underlying processes causing that some US States show slight differences from the general country estimations. From a policy perspective, future research can address this point by evaluating how the State-specific industrial configuration impacts business performance and occupational accidents. This could show exciting relationships between industries and their effects on economic performance and occupational accidents.

Third, and in connection with the analysis, specifically designed future work can evaluate the robustness of the results obtained in this study by analyzing how other State-specific variables condition work accidents, including, among others, capital intensity and number of firms.

Fourth, future studies should assess whether Occupational Health and Safety (OHS) frames-e.g., regulations and practices (Lafuente & Abad, 2021)-influence States’ production function and work safety outcomes.

Annex 1


References

References


Abrigo, M.R., & Love, I. (2016). Estimation of panel vector autoregression in Stata. The Stata Journal, 16(3), 778-804. https://doi.org/10.1177/1536867x1601600314

Andersen, L. P., Nørdam, L., Joensson, T., Kines, P., & Nielsen, K. J. (2018). Social identity, safety climate and self-reported accidents among construction workers. Construction Management and Economics, 36(1), 22-31. https://doi.org/10.1080/01446193.2017.1339360

Andrews, D.W.K., & Lu, B. (2001). Consistent model and moment selection procedures for GMM estimation with application to dynamic panel data models. Journal of Econometrics, 101, 123-164. https://doi.org/10.1016/s0304-4076(00)00077-4

Arellano, M., & Bond, S. (1991). Some tests of specification for panel data: Monte Carlo evidence and an application to employment equations. Review of Economic Studies, 58, 277-297. https://doi.org/10.2307/2297968

Boone, J., Van Ours, J.C., Wuellrich, J.P., & Zweimüller, J. (2011). Recessions are bad for workplace safety. Journal of Health Economics, 30(4), 764-773. https://doi.org/10.2139/ssrn.1842085

Boone, J., & Van Ours, J. C. (2006). Are recessions good for workplace safety? Journal of Health Economics, 25(6), 1069-1093. https://doi.org/10.1016/j.jhealeco.2006.03.002

Caselli, F., & Coleman, W.J. (2006). The World Technology Frontier. American Economic Review, 96(3), 499-522. https://doi.org/10.1257/aer.96.3.499

Cioni, M., & Savioli, M. (2016). Safety at the workplace: accidents and illnesses. Work, Employment and Society, 30(5), 858-875. https://doi.org/10.1177/0950017015590759

Cornelissen, P. A., Van Hoof, J. J., & De Jong, M. D. (2017). Determinants of safety outcomes and performance: A systematic literature review of research in four high-risk industries. Journal of Safety Research, 62, 127-141.). https://doi.org/10.1016/j.jsr.2017.06.009

Davies, R., Jones, P., & Núñez, I. (2009). The impact of the business cycle on occupational injuries in the UK. Social Science & Medicine, 69, 178-182. https://doi.org/10.1016/j.socscimed.2009.04.033

Dembe, A.E., Erickson, J.B., Delbos, R.G., & Banks, S.M. (2005). The impact of overtime and long work hours on occupational injuries and illnesses: new evidence from the United States. Occupational and Environmental Medicine, 62(9), 588-597. https://doi.org/10.1136/oem.2004.016667

GBD 2016 Occupational Risk Factors Collaborators. (2020). Global and regional burden of disease and injury in 2016 arising from occupational exposures: a systematic analysis for the Global Burden of Disease Study 2016. Occupational and Environmental Medicine, 77(3), 133-141. https://doi.org/10.1136/oemed-2019-106008

GBD 2019 Diseases and Injuries Collaborators (2021). Global burden of 369 diseases and injuries in 204 countries and territories, 1990-2019: a systematic analysis for the Global Burden of Disease Study 2019. The Lancet, 9(2), 137-150. https://doi.org/10.1016/S2215-0366(21)00395-3

García-Serrano, C., Hernanz, V., & Toharia, L. (2010). Mind the gap, please! The effect of temporary help agencies on the consequences of work accidents. Journal of Labor Research, 31(2), 162-182. https://doi.org/10.1007/s12122-010-9085-2

Gerdtham, U. G., & Ruhm, C. J. (2006). Deaths rise in good economic times: evidence from the OECD. Economics & Human Biology, 4(3), 298-316. https://doi.org/10.1016/j.ehb.2006.04.001

Hämäläinen, P., Takala, J., & Kiat, T. B. (2017). Global Estimates of Occupational Accidents and Work-Related Illnesses 2017. Workplace Safety and Health Institute, Ministry of Manpower Services Centre, Singapore.

Holtz-Eakin, D., Newey, W., & Rosen, H.S. (1988). Estimating vector autoregressions with panel data. Econometrica, 56, 1371-1395. https://doi.org/10.2307/1913103

Im, K.S., Pesaran, M.H., & Shin, Y. (2003). Testing for unit roots in heterogeneous panels. Journal of Econometrics, 115(1), 53-74. https://doi.org/10.1016/s0304-4076(03)00092-7

International Labor Organization (ILO) (2019). Safety and Health at the Future of Work: Building on 100 years of experience. https://www.ilo.org/global/topics/safety-and-health-at-work/events-training/events-meetings/world-day-for-safety/WCMS_687610/lang--en/index.htm.

Kossoris, M. (1938). Industrial injuries and the business cycle. Monthly Labor Review, 46(3), 579-594.

Lafuente, E., & Abad, J. (2021). Territorial efficiency: Analysis of the role of public work safety controls. Safety Science, 134, 105074. https://doi.org/10.1016/j.ssci.2020.105074

Lafuente, E., & Daza, V. (2020). Work inspections as a control mechanism for mitigating work accidents in Europe. TEC Empresarial, 14(1), 26-37. https://doi.org/10.2139/ssrn.3433514

Lafuente, E., Acs, Z.J., Sanders, M., & Szerb, L. (2020). The global technology frontier: productivity growth and the relevance of Kirznerian and Schumpeterian entrepreneurship. Small Business Economics, 55, 1153-178. https://doi.org/10.1007/s11187-019-00140-1

Leigh, J. P. (2011). Economic burden of occupational injury and illness in the United States. The Milbank Quarterly, 89(4), 728-772. https://doi.org/10.1111/j.1468-0009.2011.00648.x

Li, S., Xueqiu, H., & Li, C. (2011). Longitudinal relationship between economic development and occupational accidents in China. Accident Analysis & Prevention, 43(1), 82-86. https://doi.org/10.1016/j.aap.2010.07.014

Lo, C.K., Pagell, M., Fan, D., Wiengarten, F., & Yeung, A.C. (2014). OHSAS 18001 certification and operating performance: the role of complexity and coupling. Journal of Operations Management, 32(5), 268-280. https://doi.org/10.1016/j.jom.2014.04.004

Lütkepohl, H. (1993). Testing for Causation Between Two Variables in Higher-Dimensional VAR Models. In: Schneeweiß, H., Zimmermann, K.F. (eds) Studies in Applied Econometrics. Contributions to Economics. (pp. 75-91) Physica-Verlag HD. https://doi.org/10.1007/978-3-642-51514-9_4

Lütkepohl, H. (2006). Structural Vector Autoregressive Analysis for Cointegrated Variables. In, Olaf Hübler and Joachim Frohn (Eds.), Modern Econometric Analysis: Surveys on recent Developments (pp. 73-86). Springer, Berlin (Heidelberg) . https://doi.org/10.1007/3-540-32693-6_6

Nichols, T. (1989). The business-cycle and industrial injuries in British manufacturing over a quarter of a century-continuities in industrial injury research. Sociological Review, 37(3), 538-550. https://doi.org/10.1111/j.1467-954x.1989.tb00044.x

Piore, M.J., & Schrank, A. (2018). Root-Cause Regulation: Protecting Work and Workers in the Twenty-First Century. Harvard University Press. https://doi.org/10.4159/9780674986244-002

Ruhm, C.J. (1996). Are recessions good for your health? Quarterly Journal of Economics, 115(2), 617-650. https://doi.org/10.3386/w5570

Sedano-de la Fuente, V.S., Camino-López, M.A., Fontaneda-González, I., González-Alcántara, O.J., & Ritzel, D.O. (2014). The impact of the economic crisis on occupational injuries. Journal of Safety Research, 48, 77-85. https://doi.org/10.1016/j.jsr.2013.12.007

Sims, C.A. (1980). Macroeconomics and reality. Econometrica, 48, 1-48. https://doi.org/10.2307/1912017

Takala, J., Hämäläinen, P., Saarela, K.L., Yun, L.Y., Manickam, K., Jin, T.W., Heng, P., Tjong, C., Kheng, L.G., Lim, S., & Lin, G.S. (2014). Global estimates of the burden of injury and illness at work in 2012. Journal of Occupational and Environmental Hygiene, 11(5), 326-337. https://doi.org/10.1080/15459624.2013.863131

Trinkoff, A.M., Le, R., Geiger-Brown, J., Lipscomb, J., & Lang, G. (2006). Longitudinal relationship of work hours, mandatory overtime, and on-call to musculoskeletal problems in nurses. American Journal of Industrial Medicine, 49(11), 964-971. https://doi.org/10.1002/ajim.20330

Wu, Y., Schwebel, D. C., & Hu, G. (2018). Disparities in unintentional occupational injury mortality between high-income countries and low-and middle-income countries: 1990-2016. International Journal of Environmental Research and Public Health, 15(10), 2296. https://doi.org/10.3390/ijerph15102296